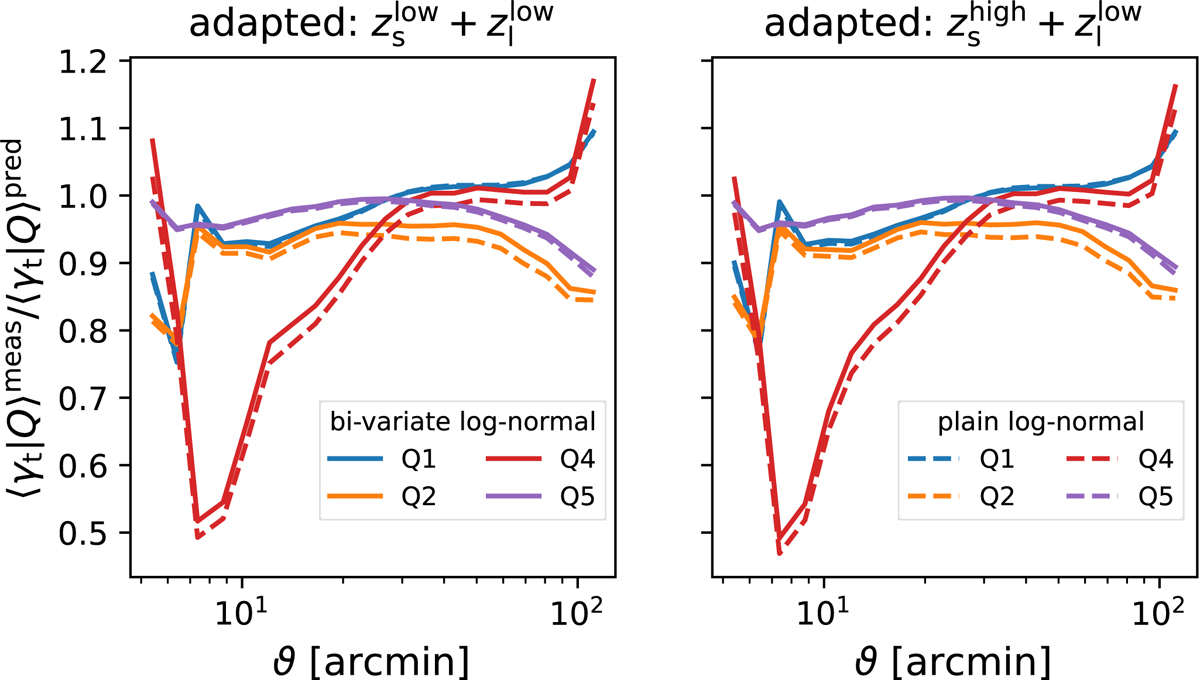
Fig. B.2.
Download original image
Comparison between the uncalibrated shear profiles for the adapted filter with and without using the bi-variate log-normal approach discussed in Sect. 3.1 The ratio is calculated between the measured shear profiles from T17 for the lower LRG source bin and for sources where several T17 shear grids were averaged, weighted by the n(z) given in Fig. 2. The bi-variate log-normal shear profiles are more consistent with the measured shear profiles and thus (although the shear signals were calibrated) the more accurate model was chosen. Here only the highest and lowest two quantiles are shown because the middle one is to close to zero.
Current usage metrics show cumulative count of Article Views (full-text article views including HTML views, PDF and ePub downloads, according to the available data) and Abstracts Views on Vision4Press platform.
Data correspond to usage on the plateform after 2015. The current usage metrics is available 48-96 hours after online publication and is updated daily on week days.
Initial download of the metrics may take a while.