Fig. 4
Download original image
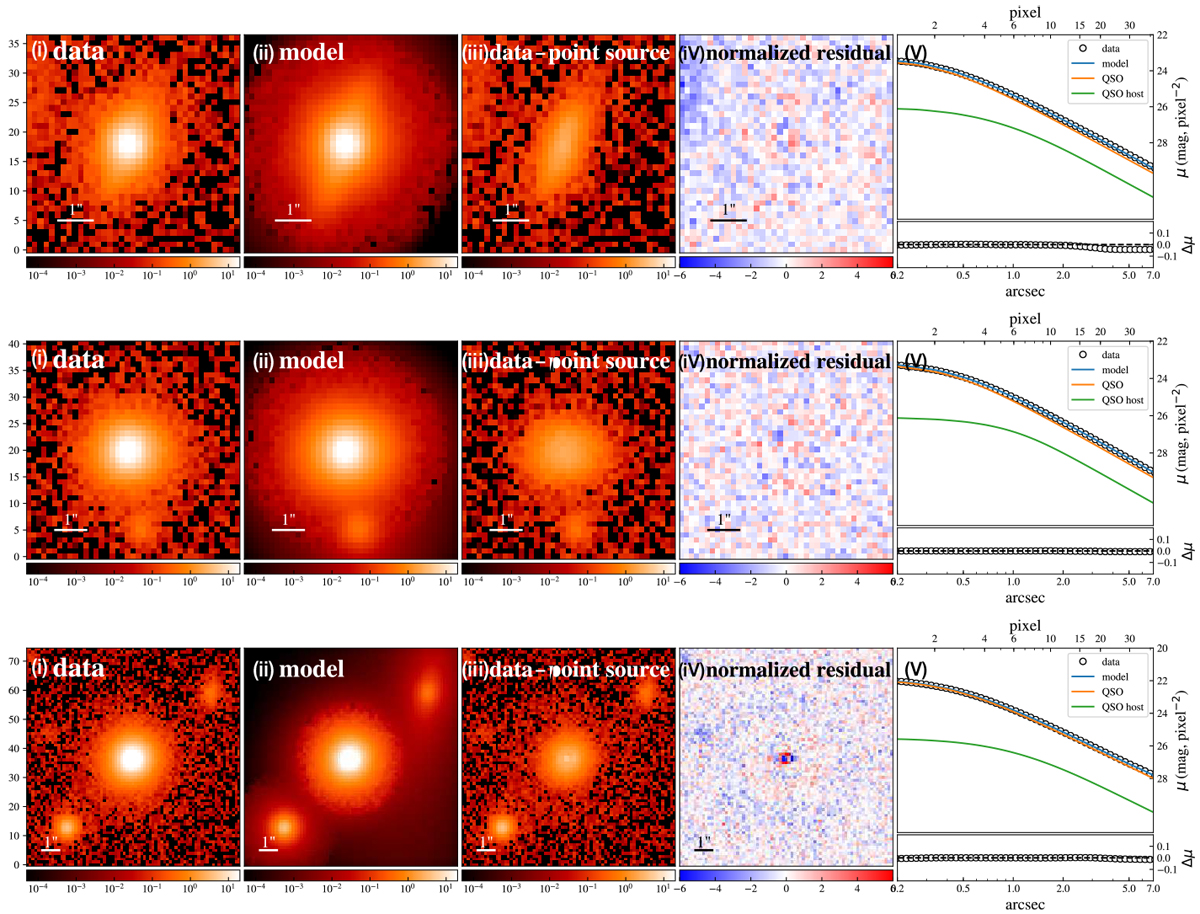
Examples of quasar-host decomposition based on the HSC i-band image. From left to right: (i) the observed HSC i-band image, (ii) the best-fit point source + host galaxy model, (iii) the data minus the point source model (the pure-galaxy image), (iv) fitting residuals divided by the variance map, and (v) one-dimensional surface brightness profiles (top) and the corresponding residuals (bottom).
Current usage metrics show cumulative count of Article Views (full-text article views including HTML views, PDF and ePub downloads, according to the available data) and Abstracts Views on Vision4Press platform.
Data correspond to usage on the plateform after 2015. The current usage metrics is available 48-96 hours after online publication and is updated daily on week days.
Initial download of the metrics may take a while.