Fig. 2
Download original image
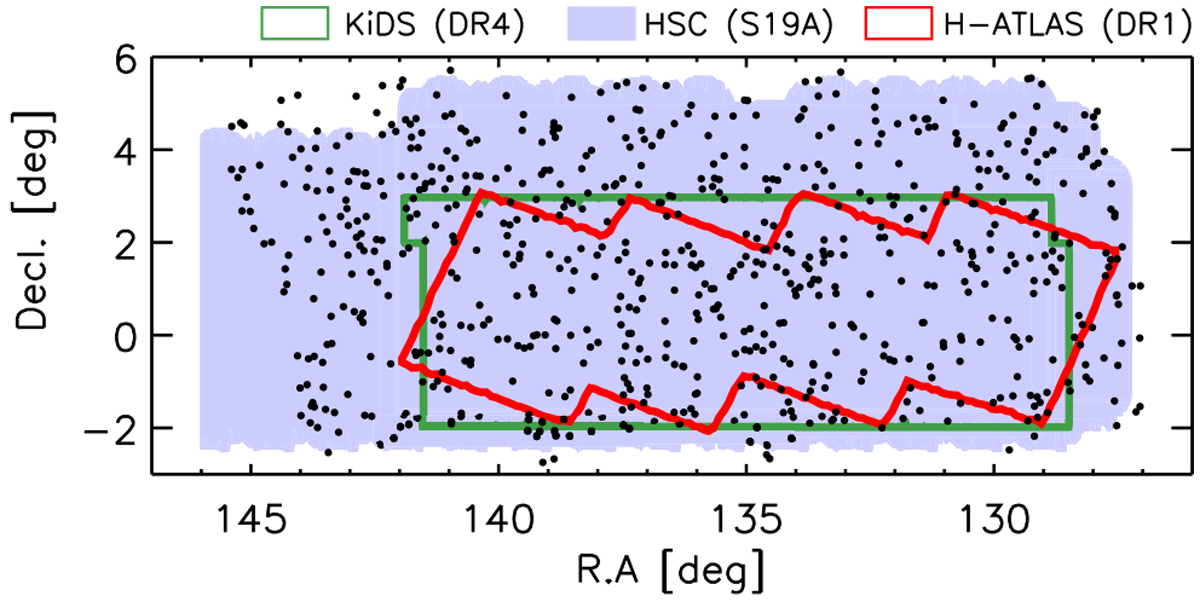
Sky distribution of the 692 eFEDS–W4-X sample (black points) in the eFEDS catalog. The blue-shaded region represents the survey footprint of the HSC-SSP S19A, while the green and red outlines represent those of KiDS DR4 and H-ATLAS DR1, respectively.
Current usage metrics show cumulative count of Article Views (full-text article views including HTML views, PDF and ePub downloads, according to the available data) and Abstracts Views on Vision4Press platform.
Data correspond to usage on the plateform after 2015. The current usage metrics is available 48-96 hours after online publication and is updated daily on week days.
Initial download of the metrics may take a while.