Fig. 19
Download original image
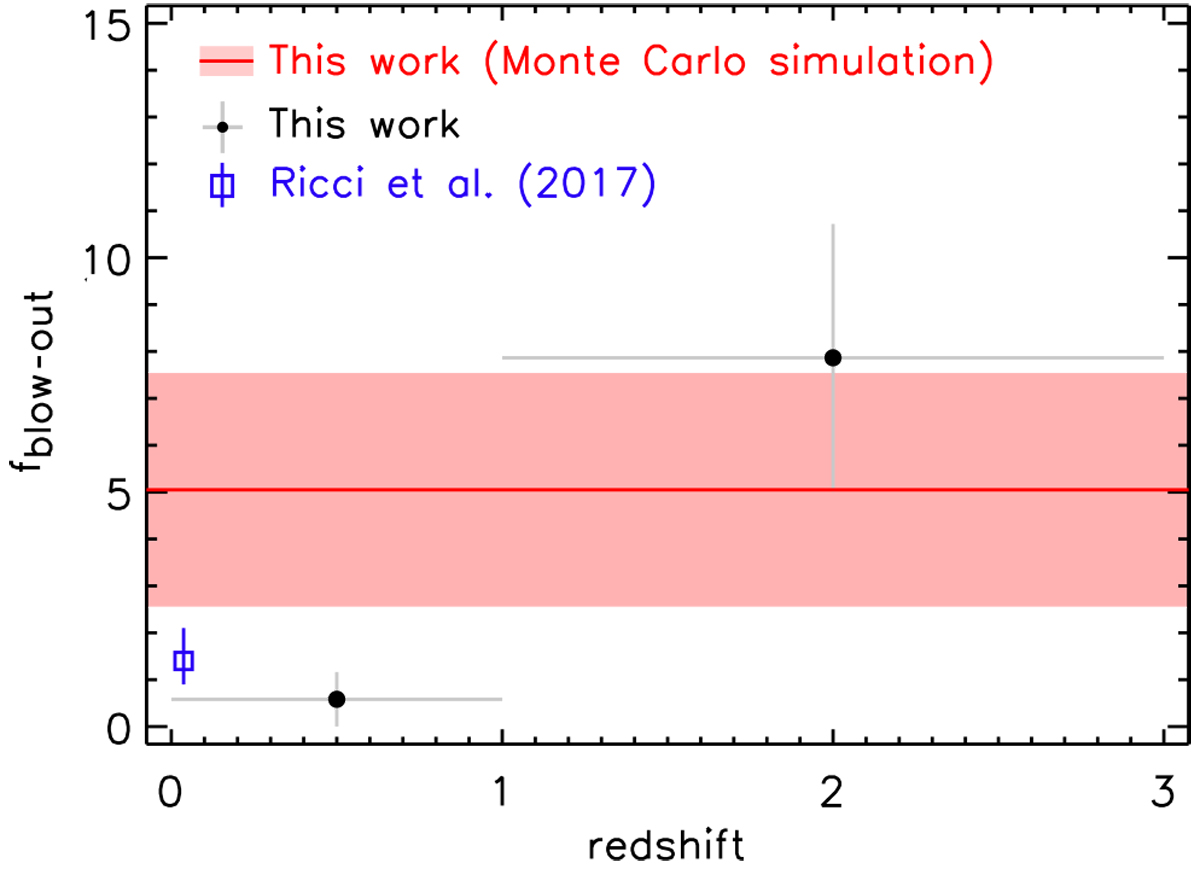
Fraction of objects in the blow-out region (fblow–out) as a function of redshift. The blue square denotes the hard-X-ray-selected AGN sample (Ricci et al. 2017), while the black points are our eFEDS–W4-X sample. The red line and shaded region represent fblow–out calculated from the Monte Carlo simulation.
Current usage metrics show cumulative count of Article Views (full-text article views including HTML views, PDF and ePub downloads, according to the available data) and Abstracts Views on Vision4Press platform.
Data correspond to usage on the plateform after 2015. The current usage metrics is available 48-96 hours after online publication and is updated daily on week days.
Initial download of the metrics may take a while.