Fig. 18
Download original image
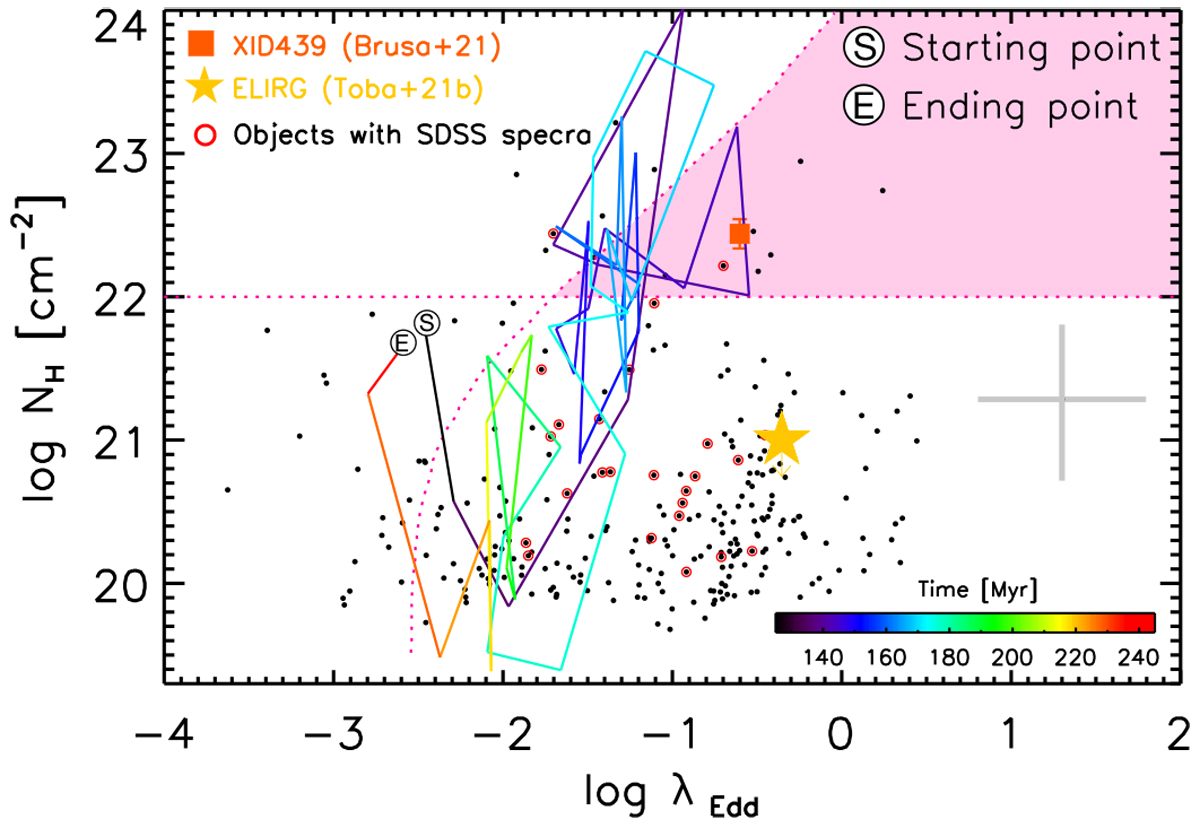
Relation between log NH and λEdd for the eFEDS–W4 sample. The yellow star represents the ELIRG (Toba et al. 2021b), and the orange square shows the location of XID439 (see text). Objects with red circles have optical spectra from SDSS DR16. Typical uncertainties in log NH and λEdd are shown at the bottom right. The dotted line denotes the effective Eddington limit (![]() ; Fabian et al. 2006) for different values of NH (Fabian et al. 2009; Ricci et al. 2017). The pink shaded area represents the blow-out region, in which the dusty gas that produces the nuclear obscuration is expected to be pushed away by radiation pressure (i.e.,
; Fabian et al. 2006) for different values of NH (Fabian et al. 2009; Ricci et al. 2017). The pink shaded area represents the blow-out region, in which the dusty gas that produces the nuclear obscuration is expected to be pushed away by radiation pressure (i.e., ![]() ). The solid line shows the evolutionary track calculated by Yutani et al. (2021), color-coded by time in units of Myr.
). The solid line shows the evolutionary track calculated by Yutani et al. (2021), color-coded by time in units of Myr.
Current usage metrics show cumulative count of Article Views (full-text article views including HTML views, PDF and ePub downloads, according to the available data) and Abstracts Views on Vision4Press platform.
Data correspond to usage on the plateform after 2015. The current usage metrics is available 48-96 hours after online publication and is updated daily on week days.
Initial download of the metrics may take a while.