Fig. 17
Download original image
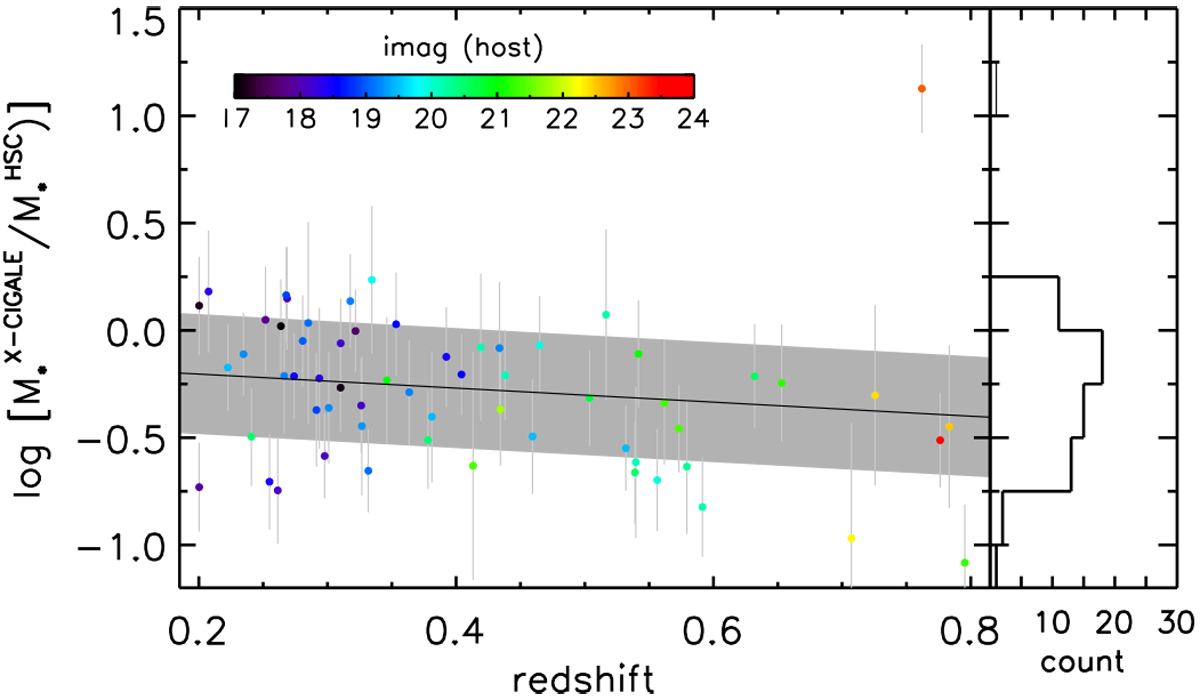
Ratio of the stellar mass derived from SED fitting with all the data ![]() to that obtained from the HSC five-band data for the AGN host galaxy
to that obtained from the HSC five-band data for the AGN host galaxy ![]() as a function of redshift, color-coded by the i-band magnitude of the AGN host. The black line and shaded region represent the best-fit relationship and the 1σ uncertainty, respectively. The histogram of the ratio is shown in the right panel.
as a function of redshift, color-coded by the i-band magnitude of the AGN host. The black line and shaded region represent the best-fit relationship and the 1σ uncertainty, respectively. The histogram of the ratio is shown in the right panel.
Current usage metrics show cumulative count of Article Views (full-text article views including HTML views, PDF and ePub downloads, according to the available data) and Abstracts Views on Vision4Press platform.
Data correspond to usage on the plateform after 2015. The current usage metrics is available 48-96 hours after online publication and is updated daily on week days.
Initial download of the metrics may take a while.