Fig. 16
Download original image
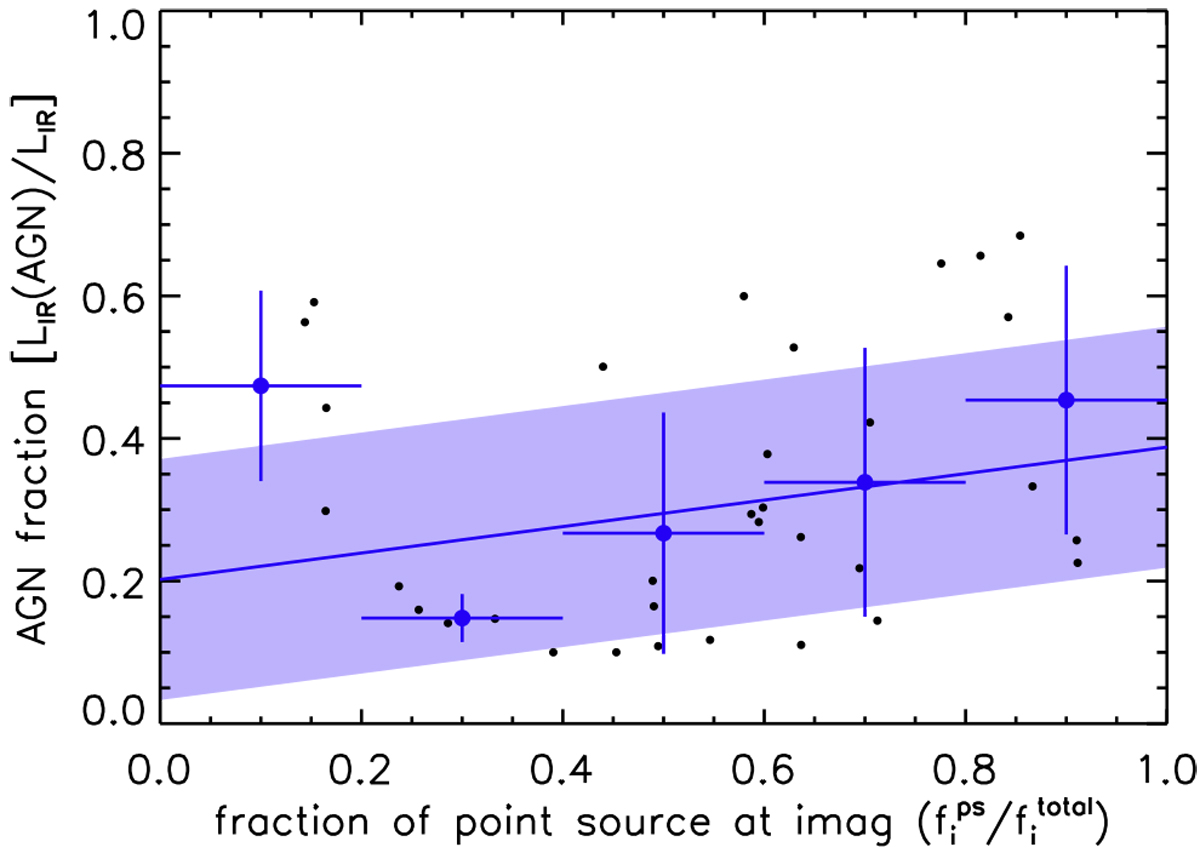
AGN fraction (LIR(AGN)/LIR) of the eFEDS–W4-X sample at 0.2 < z < 0.8 versus the point-source fraction of the i-band flux density ![]() . The black points represent the data. The blue dots with error bars represent the mean and standard deviation in each bin for the eFEDS–W4-X sources classified as X-ray type 1 AGN. The solid line and shaded region denote the best-fit relation and the 1σ uncertainty.
. The black points represent the data. The blue dots with error bars represent the mean and standard deviation in each bin for the eFEDS–W4-X sources classified as X-ray type 1 AGN. The solid line and shaded region denote the best-fit relation and the 1σ uncertainty.
Current usage metrics show cumulative count of Article Views (full-text article views including HTML views, PDF and ePub downloads, according to the available data) and Abstracts Views on Vision4Press platform.
Data correspond to usage on the plateform after 2015. The current usage metrics is available 48-96 hours after online publication and is updated daily on week days.
Initial download of the metrics may take a while.