Fig. 15

Download original image
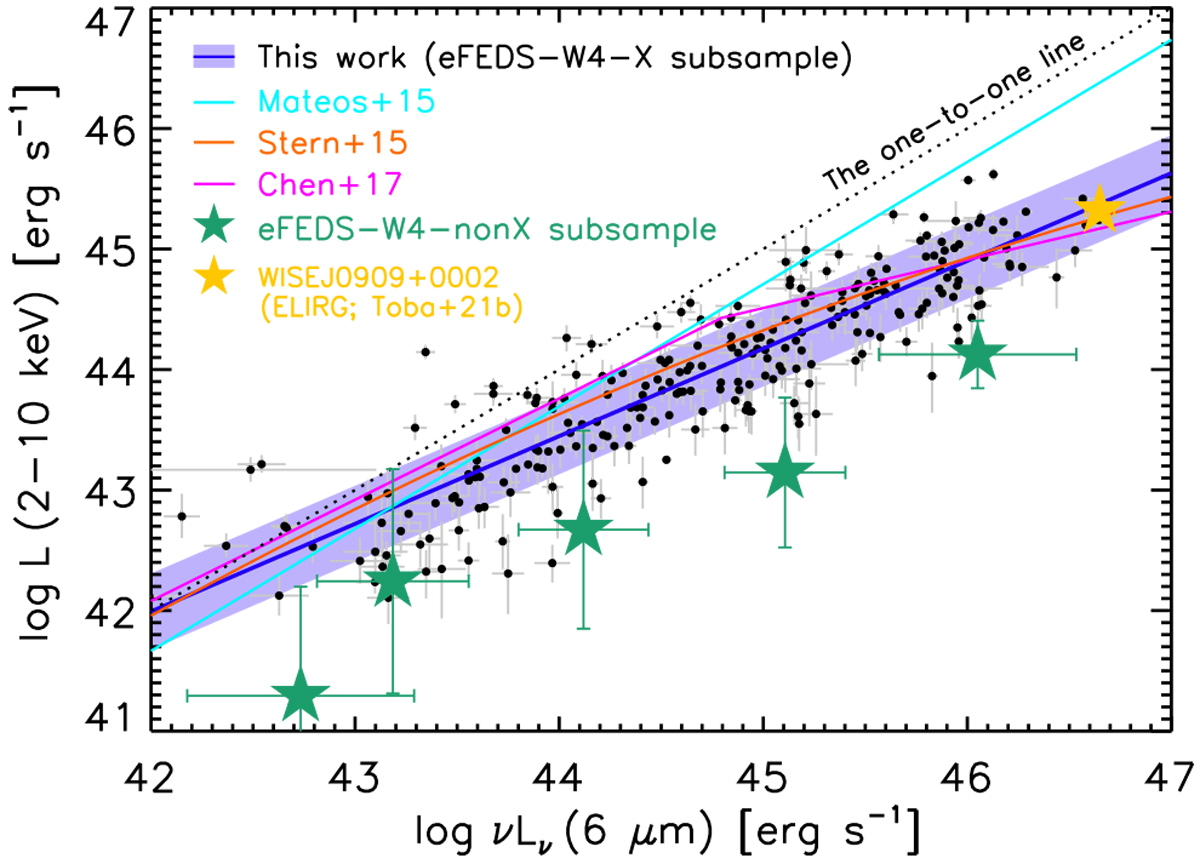
Relationship between the rest-frame 6 μm luminosity contributed by AGN and the absorption-corrected, rest-frame 2–10-keV luminosity for the eFEDS–W4 sample. The best-fit linear function in log–log space and its 1er dispersion are shown as the solid blue line and the shaded blue band, respectively. The cyan line represents the best-fit for an X-ray-selected AGN sample from the BUXS catalog (Mateos et al. 2015). The orange and magenta lines show two-dimensional polynomial and bilinear relations from Stern (2015) and Chen et al. (2017), respectively. The green stars represent the eFEDS–W4-nonX subsample used for the X-ray stacking analysis in which we obtained the weighted mean and standard deviation in each redshift bin by taking into account the uncertainties in NH (NH = 0–1023 cm−2). The black dotted line represents a one-to-one correspondence between the 6 μm and 2–10 keV luminosities. The yellow star denotes the ELIRG (WISEJ0909+0002) reported in Toba et al. (2021b).
Current usage metrics show cumulative count of Article Views (full-text article views including HTML views, PDF and ePub downloads, according to the available data) and Abstracts Views on Vision4Press platform.
Data correspond to usage on the plateform after 2015. The current usage metrics is available 48-96 hours after online publication and is updated daily on week days.
Initial download of the metrics may take a while.


