Fig. 14
Download original image
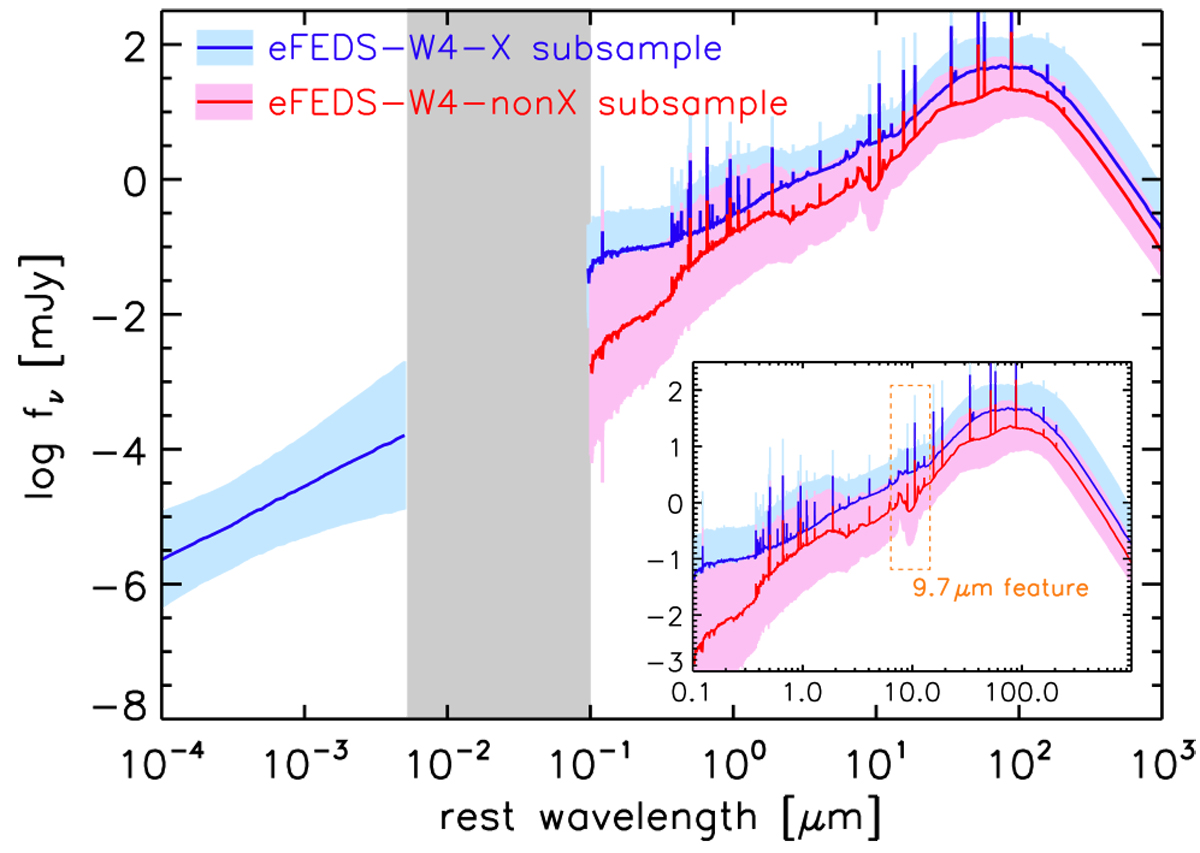
Composite SEDs of the eFEDS-W4-X subsample (blue) and eFEDS-W4-nonX subsample (red). The shaded regions represent the standard deviations of the stacked SED medians. There are no data points in the gray region, and composite SEDs are excluded. The inset displays a magnified view of the rest-frame optical-to-FIR SEDs.
Current usage metrics show cumulative count of Article Views (full-text article views including HTML views, PDF and ePub downloads, according to the available data) and Abstracts Views on Vision4Press platform.
Data correspond to usage on the plateform after 2015. The current usage metrics is available 48-96 hours after online publication and is updated daily on week days.
Initial download of the metrics may take a while.