Fig. 3
Download original image
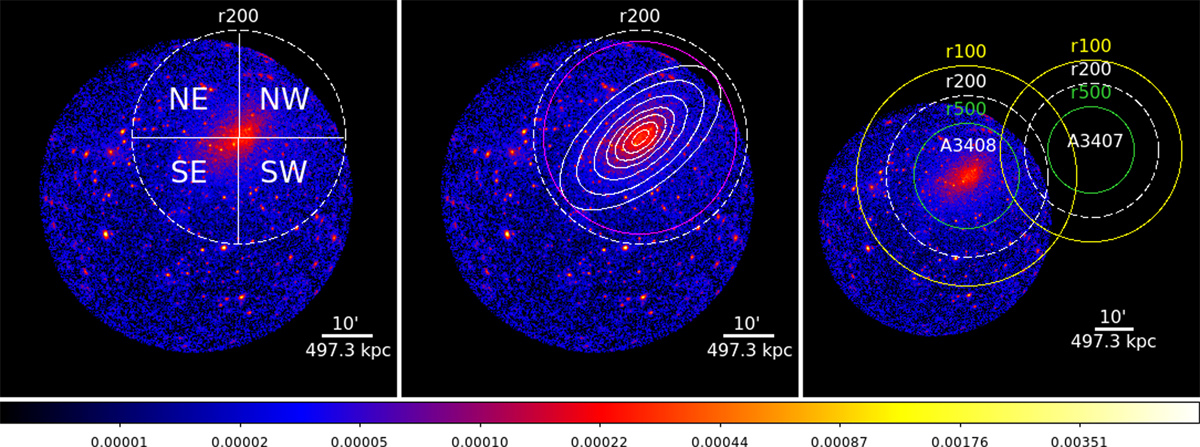
Particle background-subtracted and exposure-corrected photon image of TM 1, 2, 5, 6, and 7 in the soft band in logarithmic scale. Left: four sectors, SW, SE, NW, and NE out to r200 (dashed white lines), are illustrated. These areas were used to extract the counts for the surface brightness profiles. Center: elliptical annuli (white) out to a semimajor axis of 19 and a semiminor axis of 9.5. The annuli have the same eccentricity and angle of 40 deg, which were chosen to be visually aligned to the cluster shape. These areas were used to obtain temperature, metallicity, and normalization profiles. Furthermore, the temperature map was determined within a circular area of 19 (magenta) to ensure enough counts in the source regions for spectral fitting. Right: calculated characteristic radii r500 (green), r200 (dashed white) and r100 (yellow) of A3408 and A3407 from analyzing ROSAT data and applying the relations r100 ≈ 1.36r200 and r500 ≈ 0.65r200 in Reiprich et al. (2013).
Current usage metrics show cumulative count of Article Views (full-text article views including HTML views, PDF and ePub downloads, according to the available data) and Abstracts Views on Vision4Press platform.
Data correspond to usage on the plateform after 2015. The current usage metrics is available 48-96 hours after online publication and is updated daily on week days.
Initial download of the metrics may take a while.