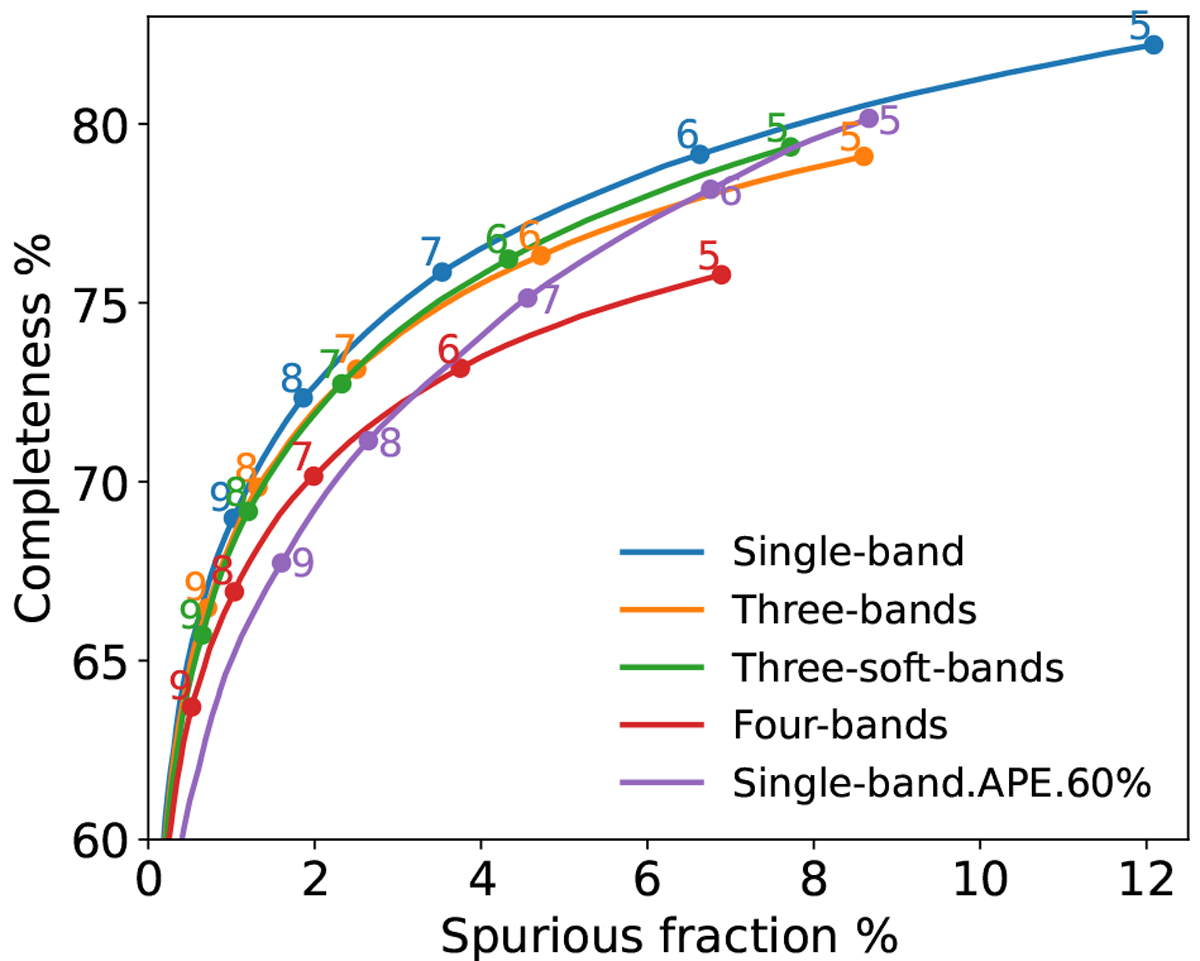
Fig. 9
Download original image
Completeness–contamination parametric curves as a function of PSF-fitting detection likelihood DET_LIKE measured from the four sets of energy bands (blue, orange, green, and red lines). The purple line indicates the selection based on the aperture Poissonian likelihood measured in the 0.2–2.3 keV band within 60% EEF. The points corresponding to the serial of DET_LIKE values are marked on the lines.
Current usage metrics show cumulative count of Article Views (full-text article views including HTML views, PDF and ePub downloads, according to the available data) and Abstracts Views on Vision4Press platform.
Data correspond to usage on the plateform after 2015. The current usage metrics is available 48-96 hours after online publication and is updated daily on week days.
Initial download of the metrics may take a while.