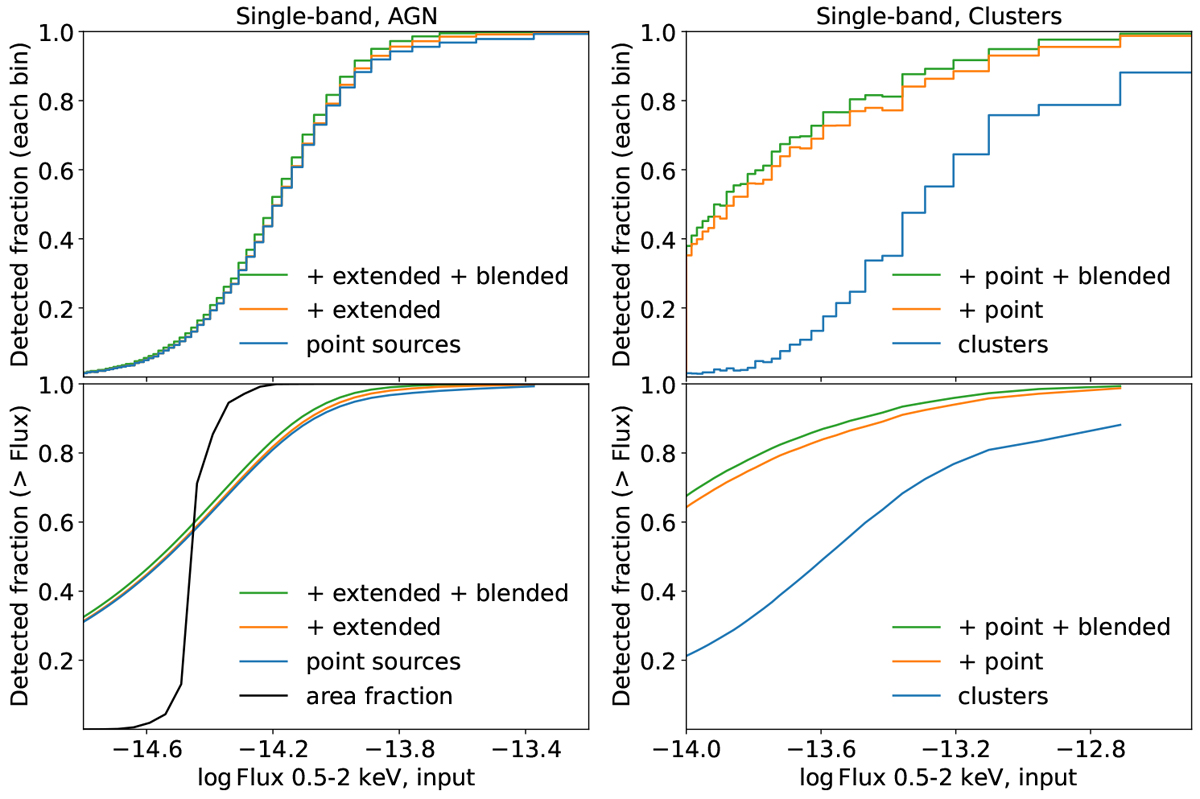
Fig. 6
Download original image
Completeness of AGN (left) and completeness of clusters (right) in the single-band-detected catalog as a function of the input 0.5–2 keV flux in differential (top) and cumulative manners (bottom). The blue lines indicate sources that are detected (as ID_Uniq) and correctly classified as point sources (in the left panel) or as extended sources (in the right panel). The orange lines indicate sources that are detected (as ID_Uniq) regardless of classification, so that extended sources are also included in the left panel and point sources are also included in the right panel. The green lines indicate sources that are detected as either primary (ID_Uniq) or secondary (ID_Any2) counterparts, so that the cases of blended sources are included. The black line in the left panel shows the sensitivity curve of the single-band-detected catalog calculated using ersensmap in terms of fractional area at a given flux limit.
Current usage metrics show cumulative count of Article Views (full-text article views including HTML views, PDF and ePub downloads, according to the available data) and Abstracts Views on Vision4Press platform.
Data correspond to usage on the plateform after 2015. The current usage metrics is available 48-96 hours after online publication and is updated daily on week days.
Initial download of the metrics may take a while.