Fig. 4
Download original image
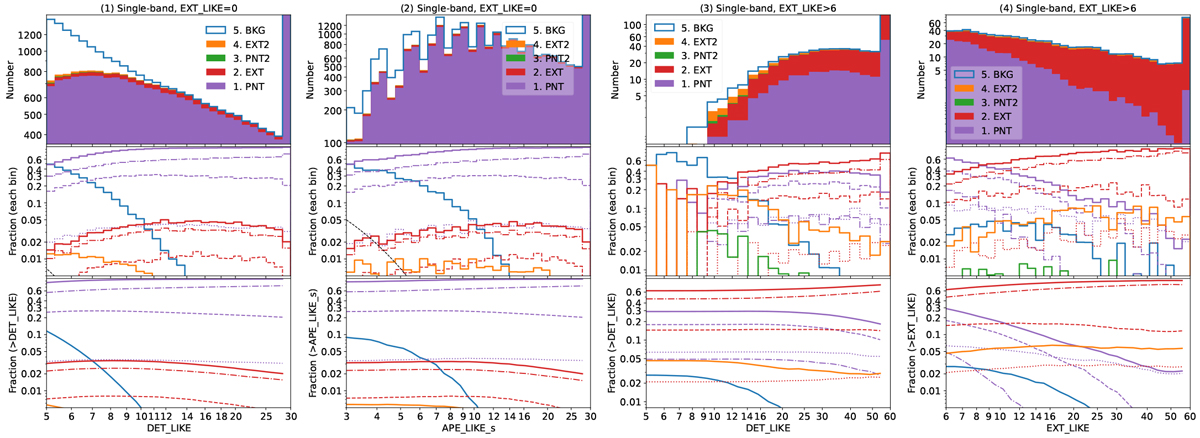
Same as Fig. 3, but for different sample selections and/or different variables. The panel number and selection rules are printed in the figure titles, i.e., panels 1–2 for point sources (EXT_LIKE=0) and panels 3–4 for extended sources (EXT_LIKE>6), both of which are selected from the single-band-detected catalog. The four panels display the selected subsamples as a function of (1) single-band detection likelihood (DET_LIKE), (2) 0.5–2 keV aperture-photometry-based likelihood (APE_LIKE_s), (3) DET_LIKE, and (4) extent likelihood (EXT_LIKE). The dashed black lines in the middle subpanel of panels 1–2 correspond to probability=exp(-likelihood).
Current usage metrics show cumulative count of Article Views (full-text article views including HTML views, PDF and ePub downloads, according to the available data) and Abstracts Views on Vision4Press platform.
Data correspond to usage on the plateform after 2015. The current usage metrics is available 48-96 hours after online publication and is updated daily on week days.
Initial download of the metrics may take a while.