Fig. A.1
Download original image
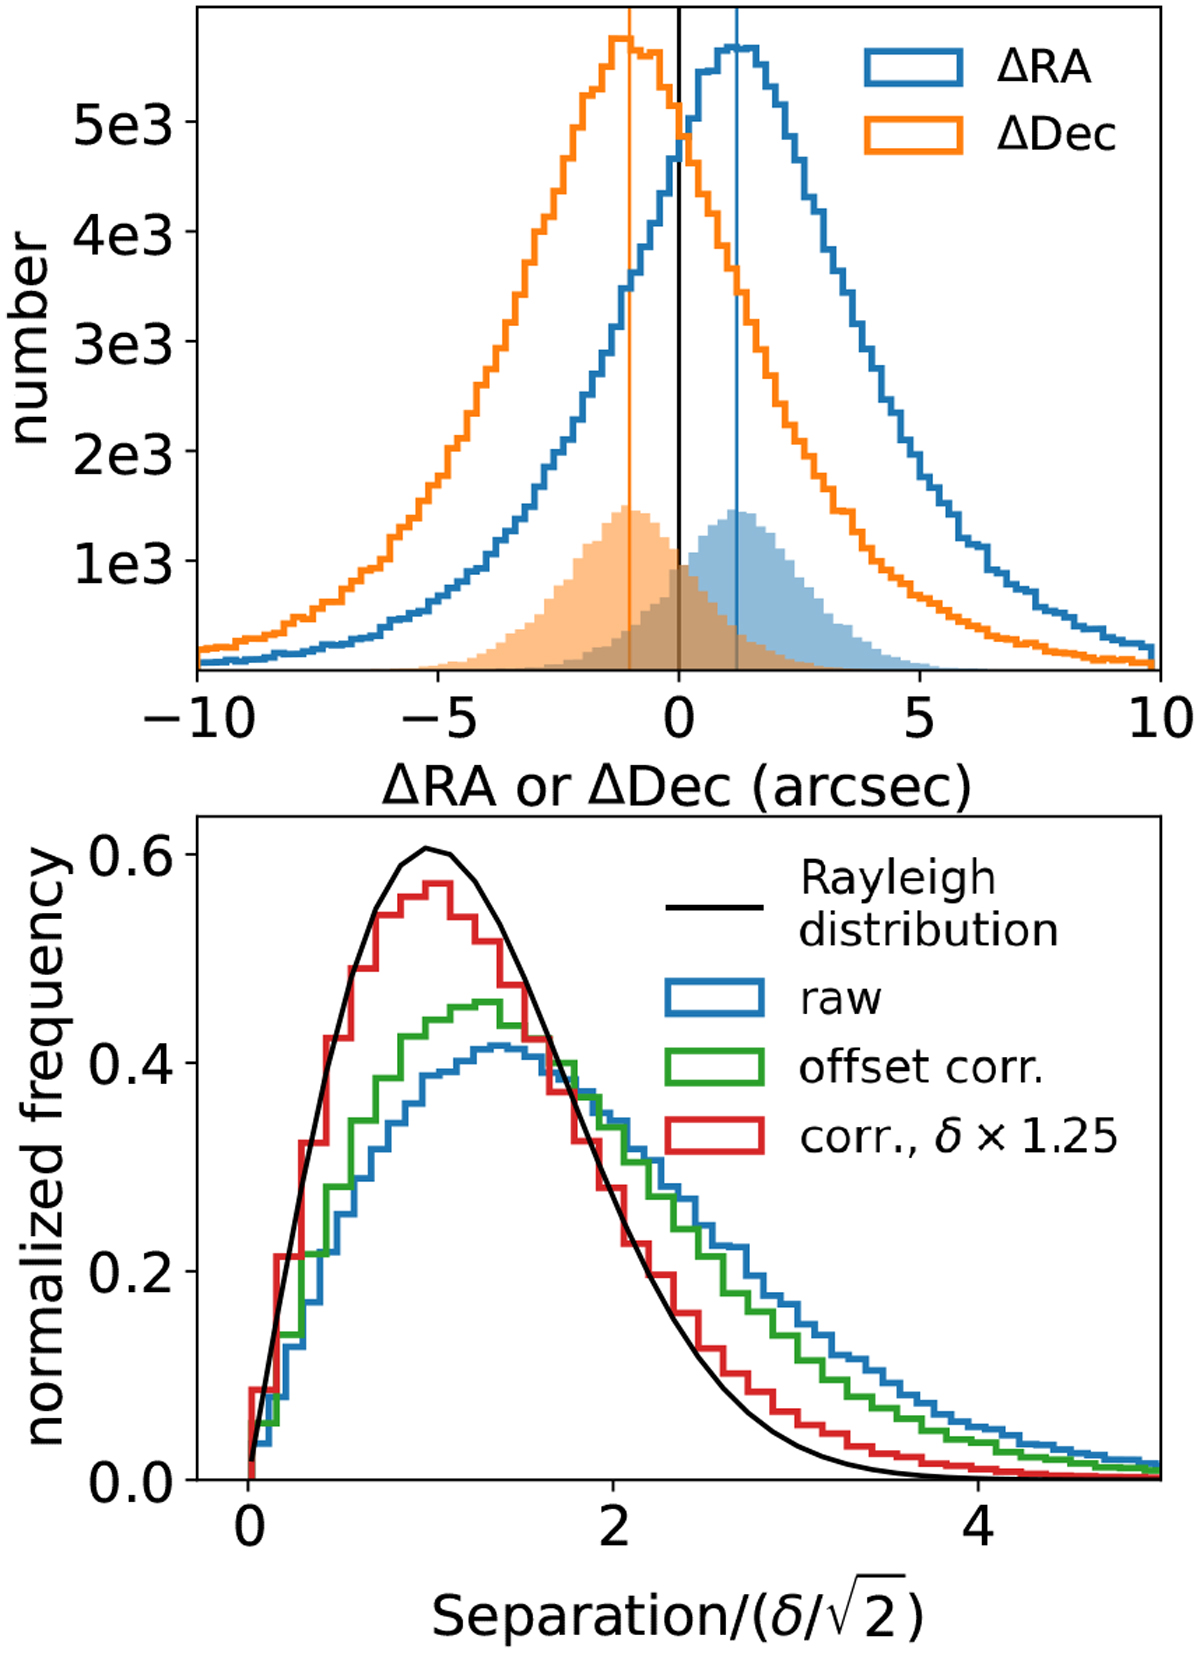
Distributions of RAout-RAin (blue, top) and Decout-Decin (orange, top). The filled histograms indicate subsamples of very bright sources with detection likelihoods >100. The full samples and the sub-samples have a median ΔRA= 1.2″ (vertical blue line) and a median ΔDec= −1.0″ (vertical orange line). The lower panel displays the distribution of input-output separation in terms of the ratio to the ID positional uncertainty in comparison with the Rayleigh distribution. The blue histogram shows the raw measurements. The distribution after correcting the detected positions for the median offsets is plotted in green. Then we further multiply the measured positional uncertainty by a factor of 1.25 and plot the distribution in red.
Current usage metrics show cumulative count of Article Views (full-text article views including HTML views, PDF and ePub downloads, according to the available data) and Abstracts Views on Vision4Press platform.
Data correspond to usage on the plateform after 2015. The current usage metrics is available 48-96 hours after online publication and is updated daily on week days.
Initial download of the metrics may take a while.