Fig. 12
Download original image
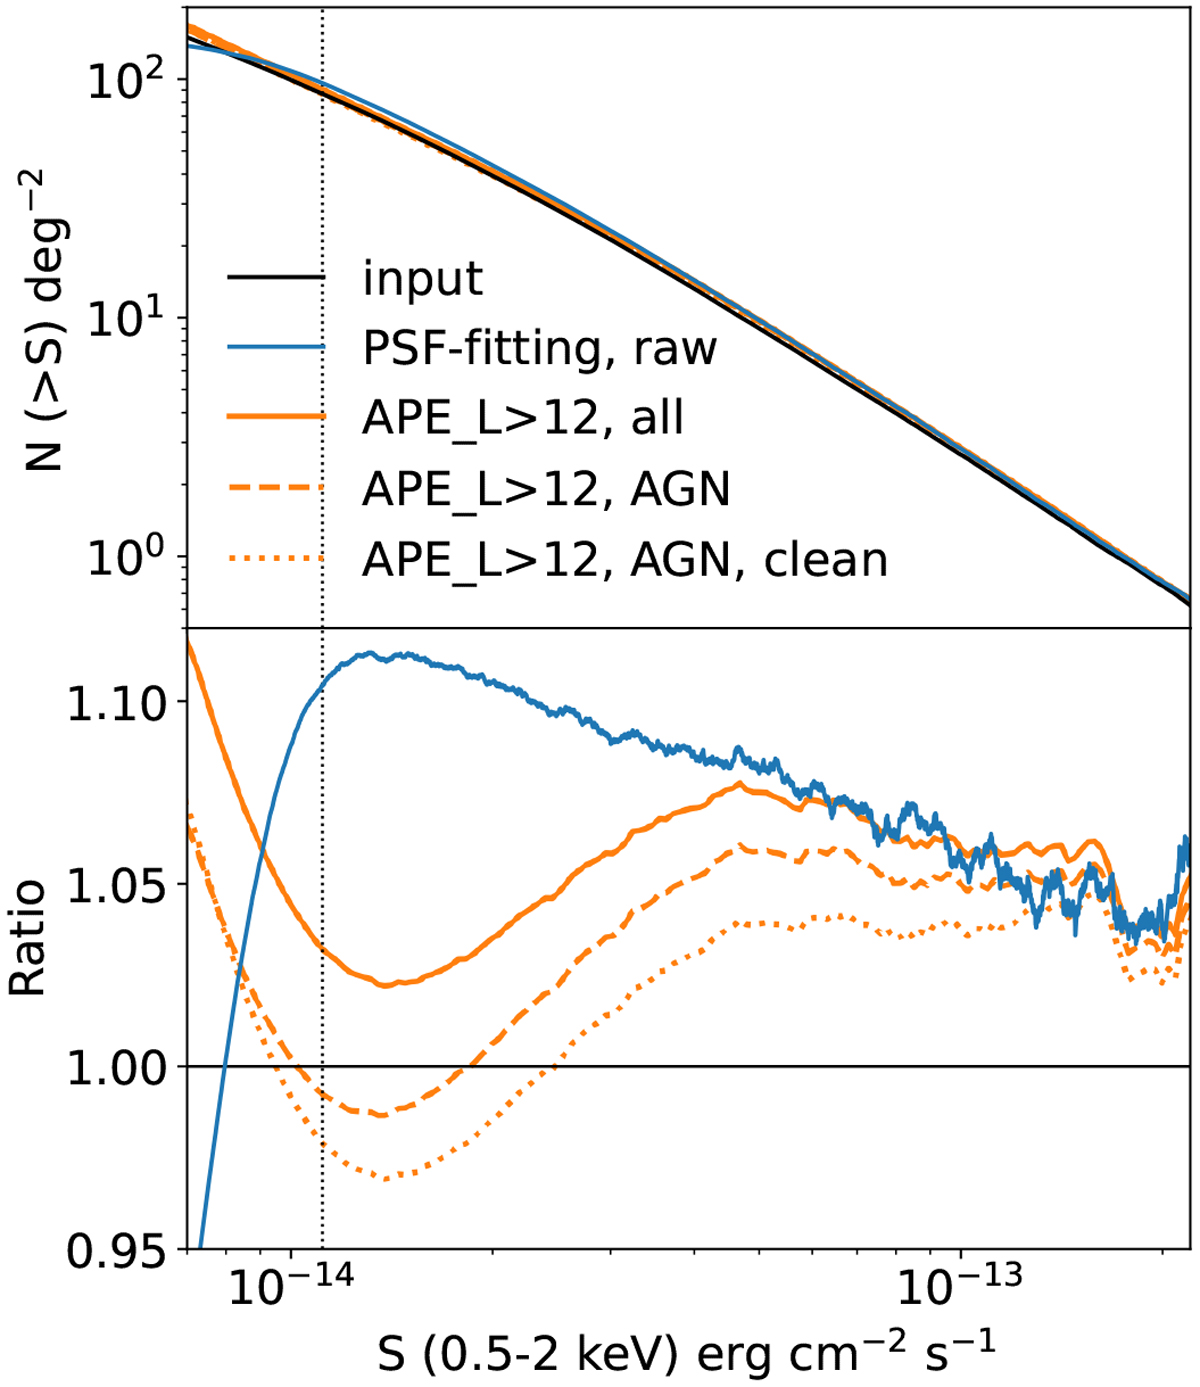
Iput (solid black line) and output number counts of AGN (upper panel) and the output-to-input ratios (lowerpanel). The blue lines correspond to the raw cumulative distribution of 0.5–2 keV fluxes measured by forced PSF fitting divided by the total area. The solid orange line shows the number counts we constructed based on the aperture Pois-sonian likelihood APE_LIKE using all the sources with APE_LIKE>12. When only the genuine AGN instead of all the sources (including misclassified clusters) is used, the result is displayed as the dashed orange line. After a further flux correction when constructing the number counts of genuine AGN, the result is displayed as the dotted orange line. The vertical dotted line (1.1 × 10⁻¹⁴ ergcm−2 s−1) corresponds to a sensitivity of 50%.
Current usage metrics show cumulative count of Article Views (full-text article views including HTML views, PDF and ePub downloads, according to the available data) and Abstracts Views on Vision4Press platform.
Data correspond to usage on the plateform after 2015. The current usage metrics is available 48-96 hours after online publication and is updated daily on week days.
Initial download of the metrics may take a while.