Fig. 1
Download original image
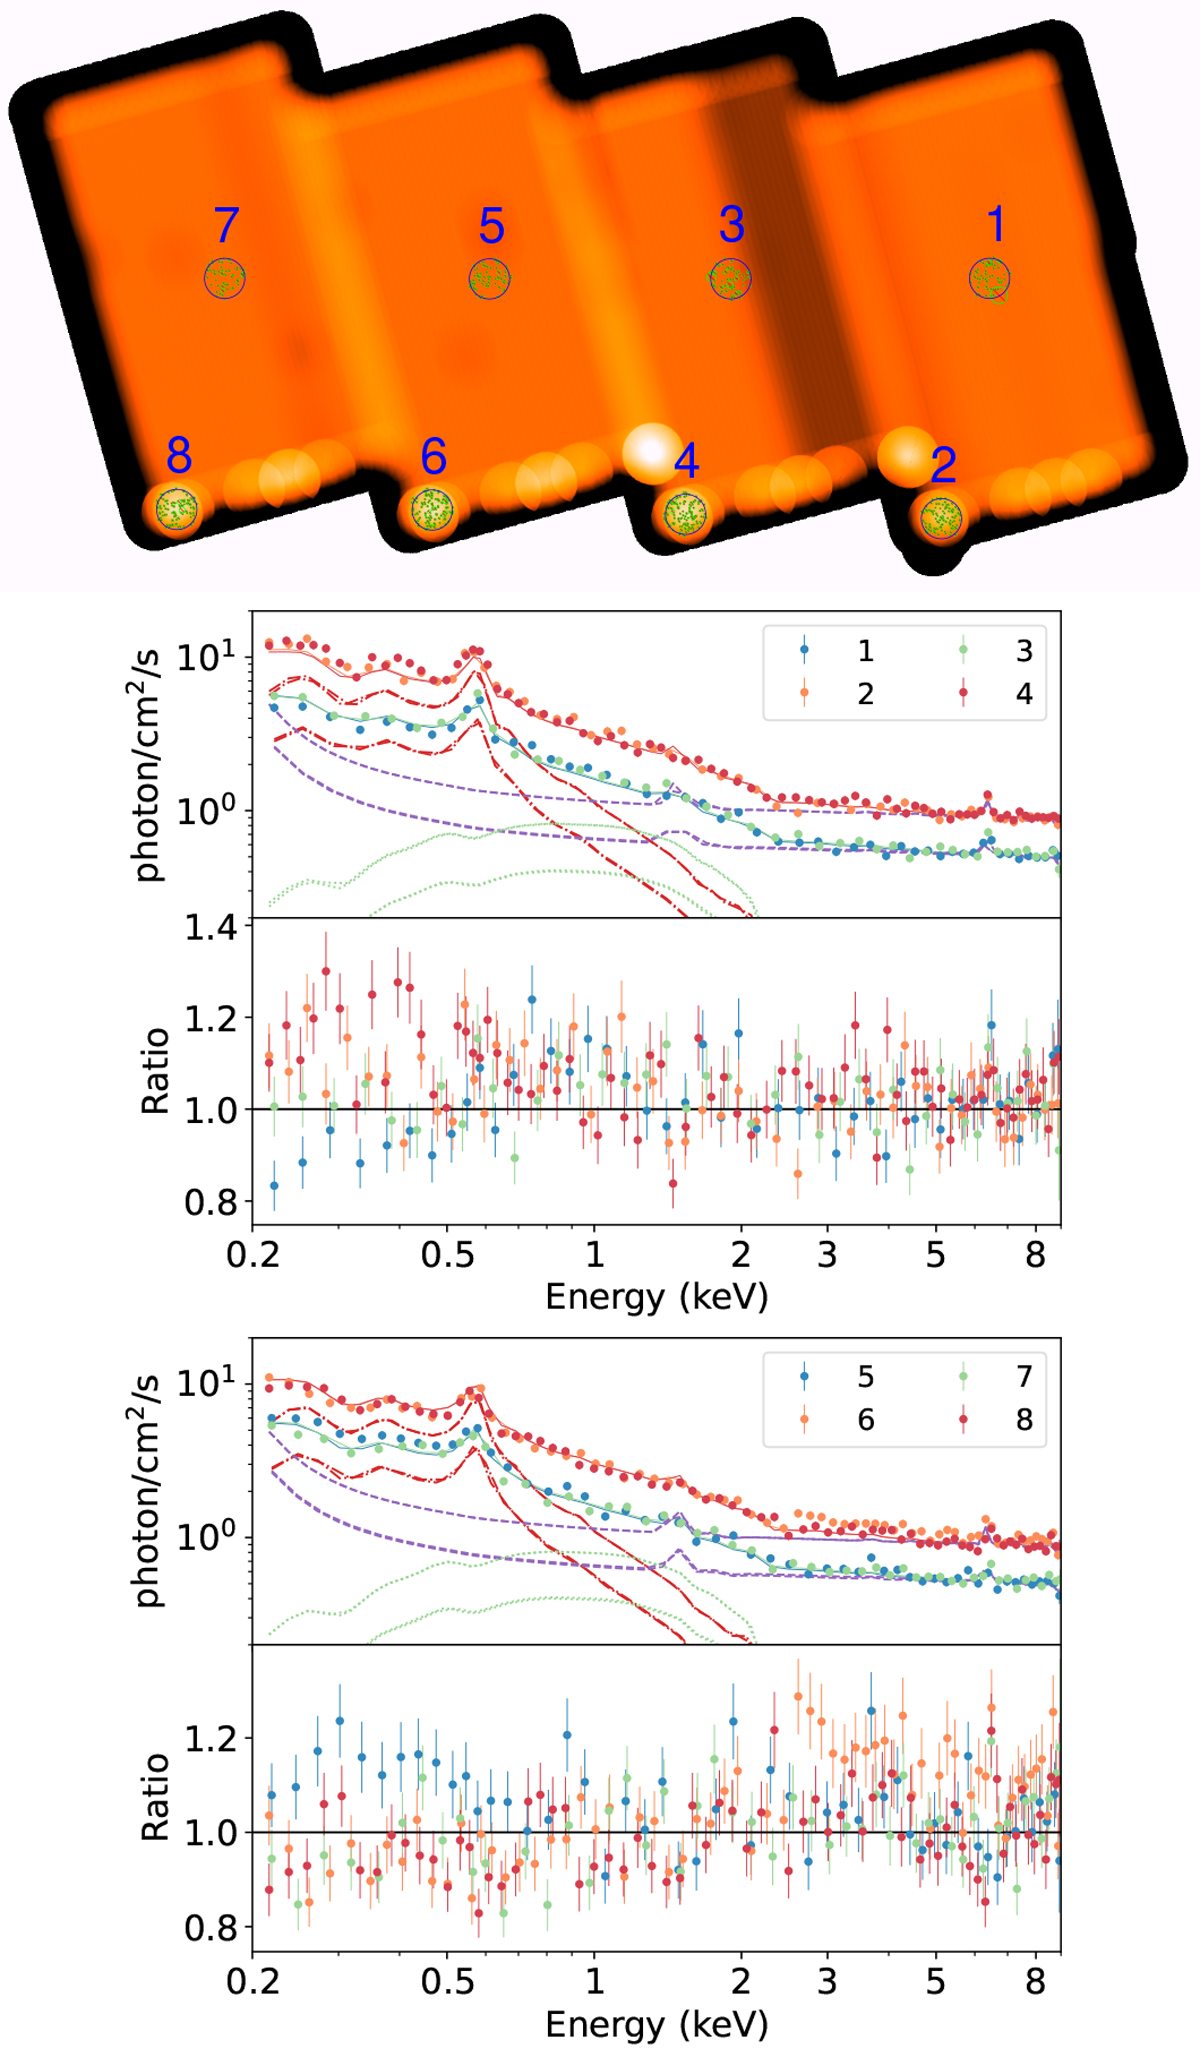
Eight background extraction regions with radius 20′ overlaid on the 0.2–2.3 keV exposure map of eFEDS (top). To avoid overlapping, the eight spectra are displayed separately in the two lower panels in terms of the data (points), the model (solid lines), and the data-to-model ratio. The purple, green, and red lines indicate the averaged particle background, the mock cosmic X-ray background, and the diffuse Galactic X-ray background, respectively. All the lines correspond to the same model with the same flux for the eight spectra. The count rate in the spectra was calculated based on the total exposure time, which is longer than the effective exposure depth in survey mode because the extraction region is not always covered by the moving FOV. The difference (by a factor of ~2) between regions 1, 3, 5, and 7 and regions 2, 4, 6, and 8 reflects the different effective exposure depths. We did correct for the count rate because the uncorrected data look better for the representation.
Current usage metrics show cumulative count of Article Views (full-text article views including HTML views, PDF and ePub downloads, according to the available data) and Abstracts Views on Vision4Press platform.
Data correspond to usage on the plateform after 2015. The current usage metrics is available 48-96 hours after online publication and is updated daily on week days.
Initial download of the metrics may take a while.