Fig. 9
Download original image
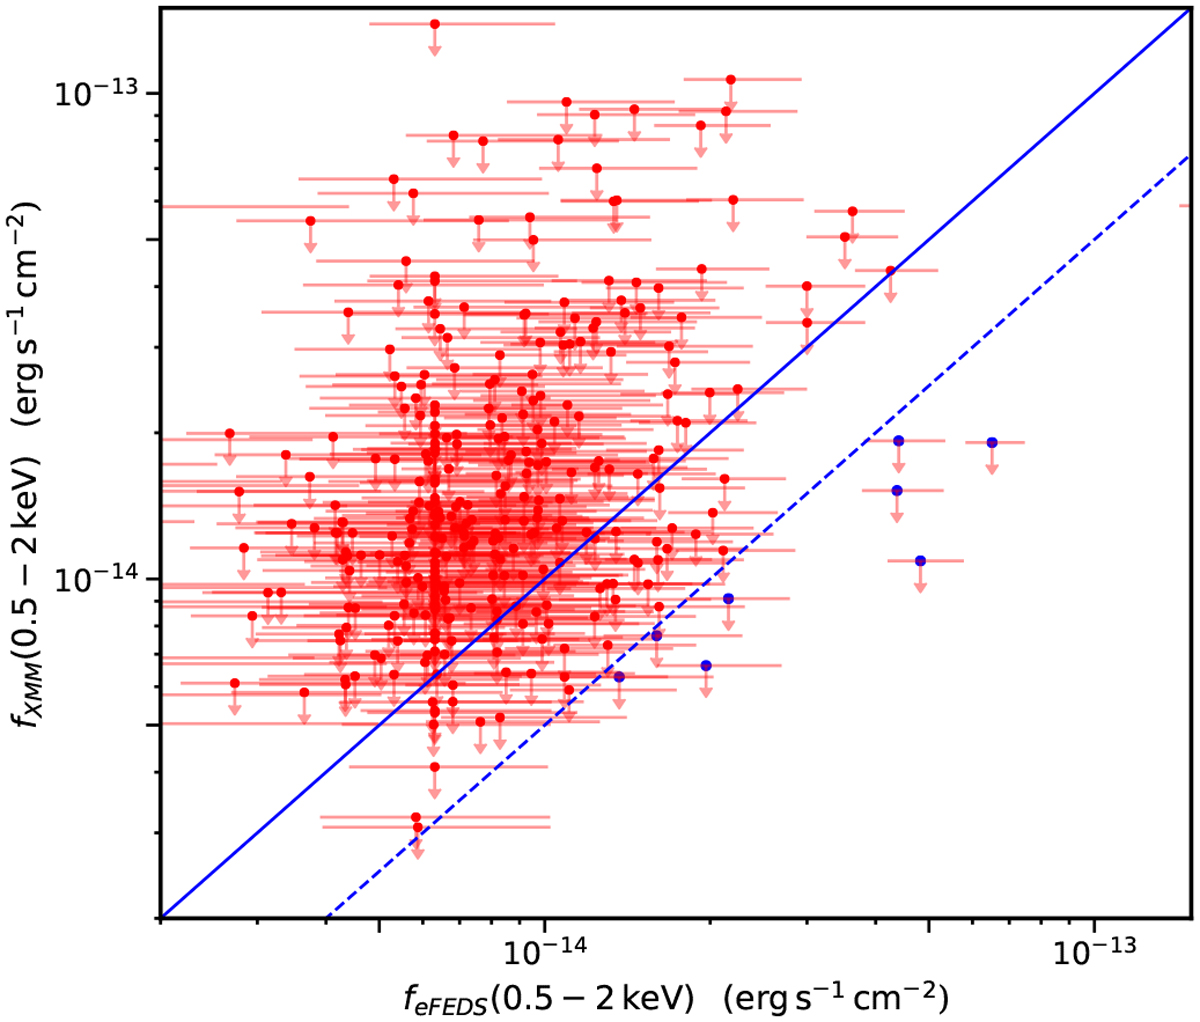
eFEDS 0.5–2 keV flux vs. XMM-ATLAS flux upper-limit (3σ confldence) in the 0.5–2 keV. Each data point in this plot corresponds to an eFEDS source detection without a counterpart in the eFEDS source catalogue. For these sources, the 3σ flux upper limits are estimated from the XMM-ATLAS observations and plotted on the vertical axis. The solid blue line indicates the one-to-one relation. The dotted blue line corresponds to a factor of two in flux relative to the one-to-one relation, i.e. sources with XMM-ATLAS 3σ flux upper limits that are twice fainter than the XMM-ATLAS source flux. Sources below this line are highlighted in blue. Their properties are listed in Table 6.
Current usage metrics show cumulative count of Article Views (full-text article views including HTML views, PDF and ePub downloads, according to the available data) and Abstracts Views on Vision4Press platform.
Data correspond to usage on the plateform after 2015. The current usage metrics is available 48-96 hours after online publication and is updated daily on week days.
Initial download of the metrics may take a while.