Fig. 6
Download original image
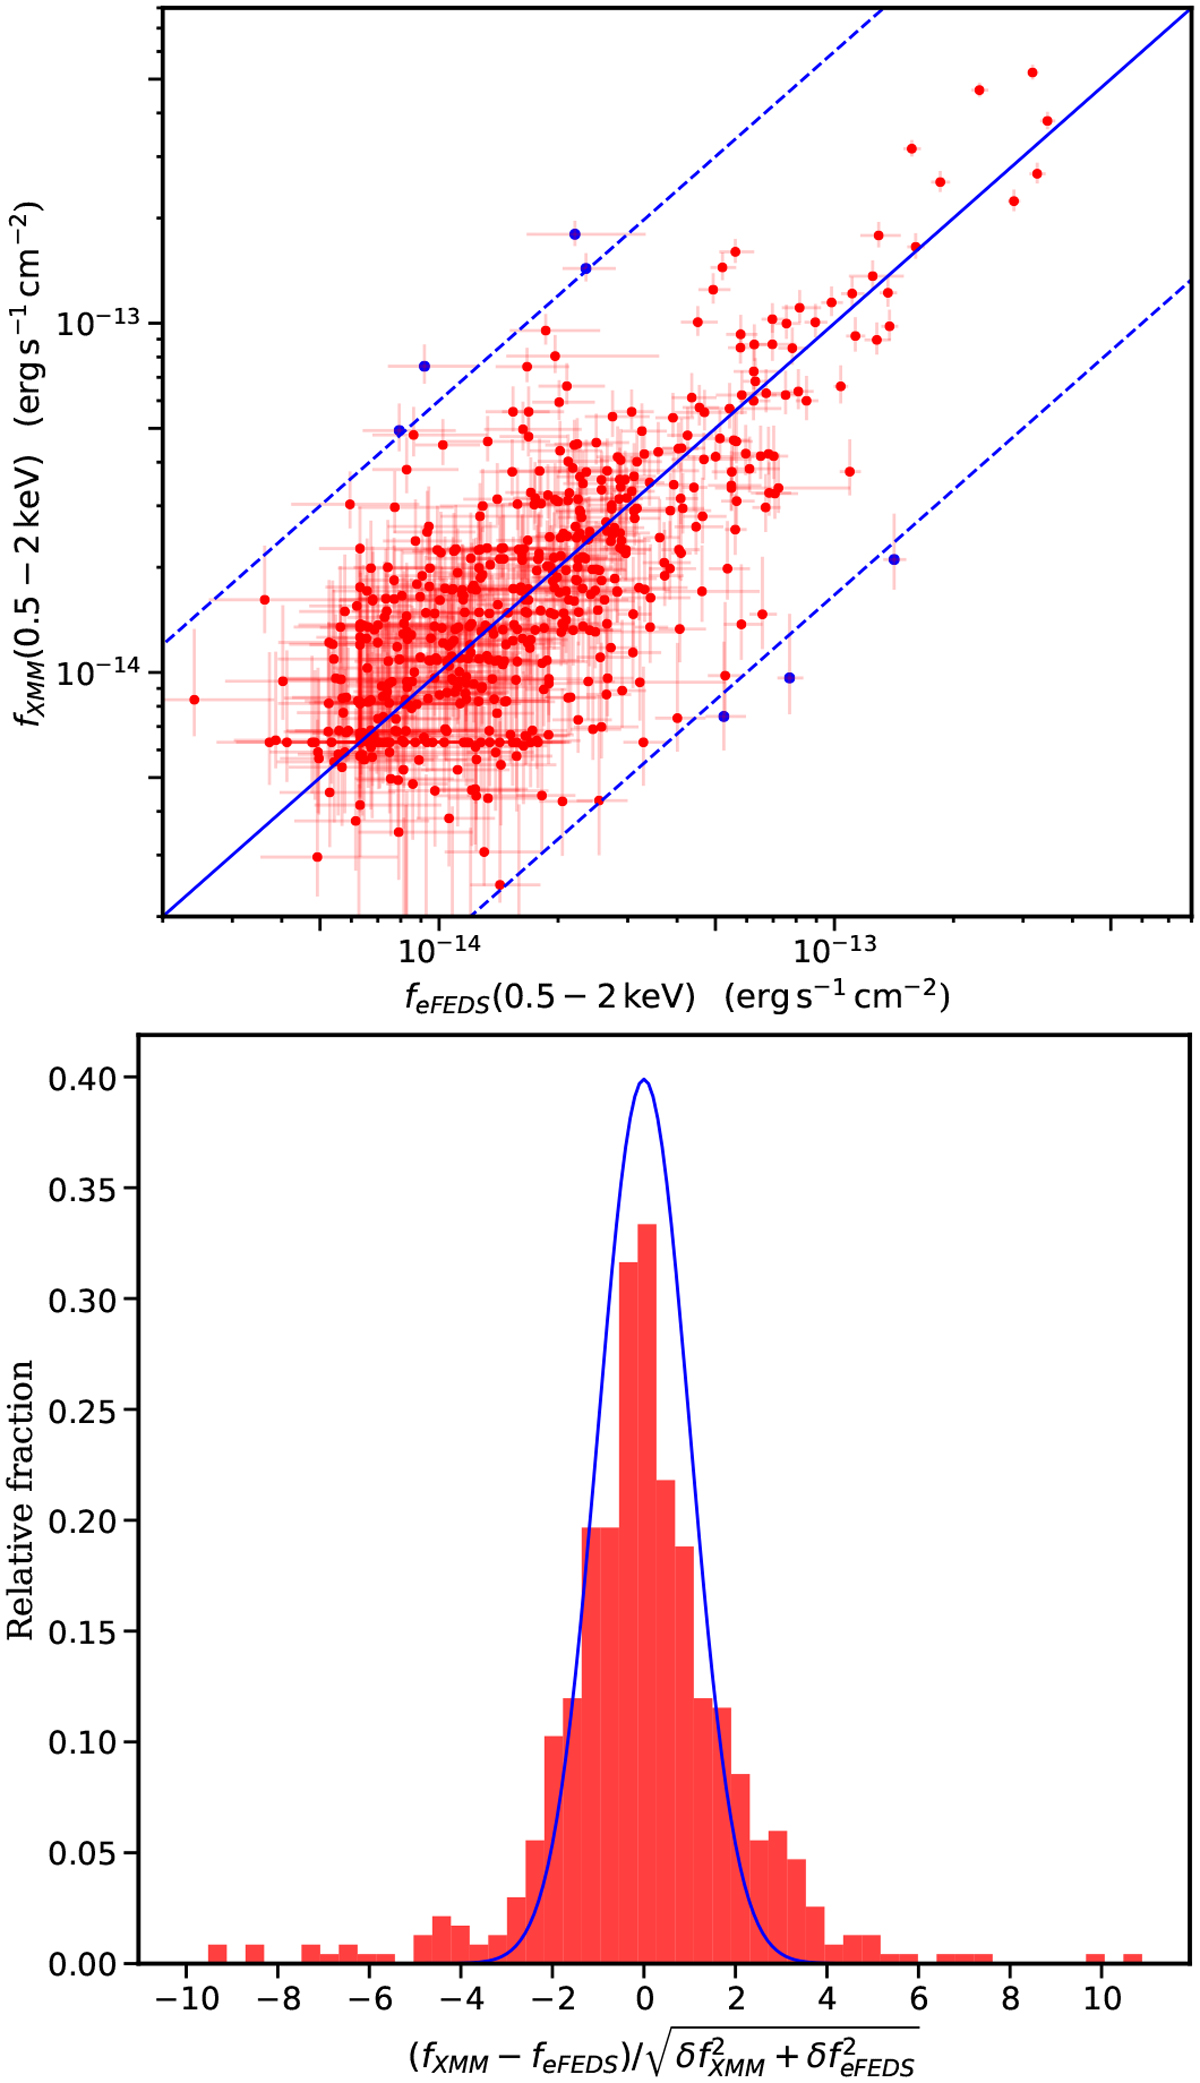
Top panel: XMM-Atlas vs. eFEDS fluxes in the 0.5–2 keV band. The solid blue line shows the one-to-one relation. The dotted blue lines correspond to a flux ratio of 6. Sources with fluxes that differ by more than this factor in the two surveys are shown in blue. Bottom panel: distribution of the flux difference of X-ray sources between the XMM-ATLAS and eFEDS observations. The blue line shows a Gaussian distribution with zero mean and unity scatter. The histogram of the normalised flux difference has more power in the wings than in the normal distribution, which we attribute to variability.
Current usage metrics show cumulative count of Article Views (full-text article views including HTML views, PDF and ePub downloads, according to the available data) and Abstracts Views on Vision4Press platform.
Data correspond to usage on the plateform after 2015. The current usage metrics is available 48-96 hours after online publication and is updated daily on week days.
Initial download of the metrics may take a while.