Fig. 5
Download original image
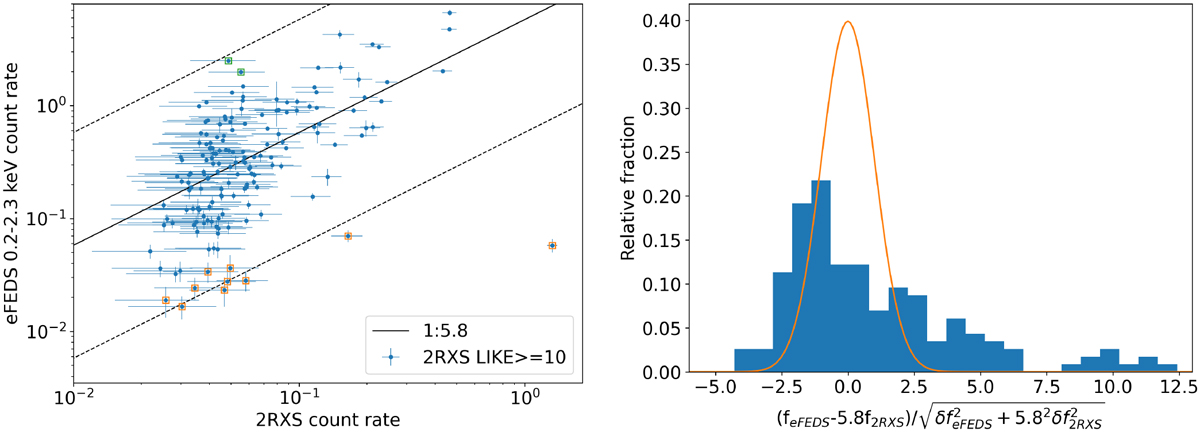
Left panel: 2RXS vs. eFEDS count rates for the sources in common to both catalogues. The solid black line corresponds to the median count rate ratio of 5.8. The dashed lines correspond to a variability factor of 10 with respect to the median ratio (black solid line). Sources with variability factors >6 are marked with green or orange squares. Right panel: distribution of the variability factor. The orange line displays the standard normal distribution (unity scatter, zero mean).
Current usage metrics show cumulative count of Article Views (full-text article views including HTML views, PDF and ePub downloads, according to the available data) and Abstracts Views on Vision4Press platform.
Data correspond to usage on the plateform after 2015. The current usage metrics is available 48-96 hours after online publication and is updated daily on week days.
Initial download of the metrics may take a while.