Fig. 3
Download original image
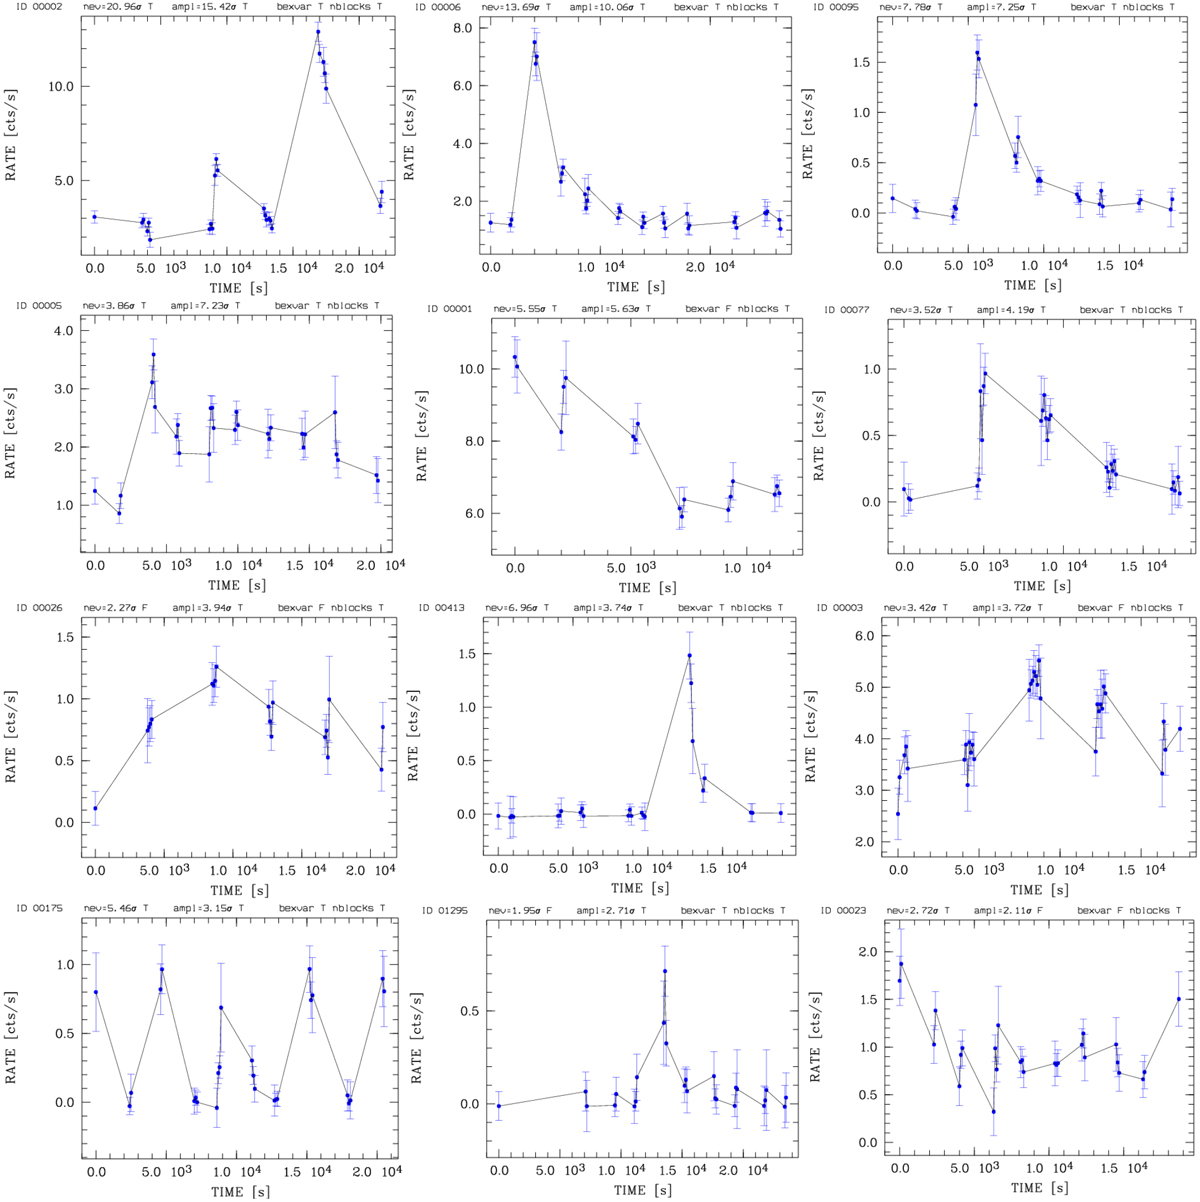
Light curves for the 12 most variable eFEDS sources. The bin size is 100 s and the energy band is band 1. The objects are ordered from top left to right bottom in descending maximum amplitude σ values. For the normalized excess variance and the maximum amplitude variability the values in units of σ are indicated along the top of each panel. The variability flags (T for true and F for false) are also listed for the Bayesian excess variance (bexvar), and the Bayesian block method (nblocks).
Current usage metrics show cumulative count of Article Views (full-text article views including HTML views, PDF and ePub downloads, according to the available data) and Abstracts Views on Vision4Press platform.
Data correspond to usage on the plateform after 2015. The current usage metrics is available 48-96 hours after online publication and is updated daily on week days.
Initial download of the metrics may take a while.