Fig. 2
Download original image
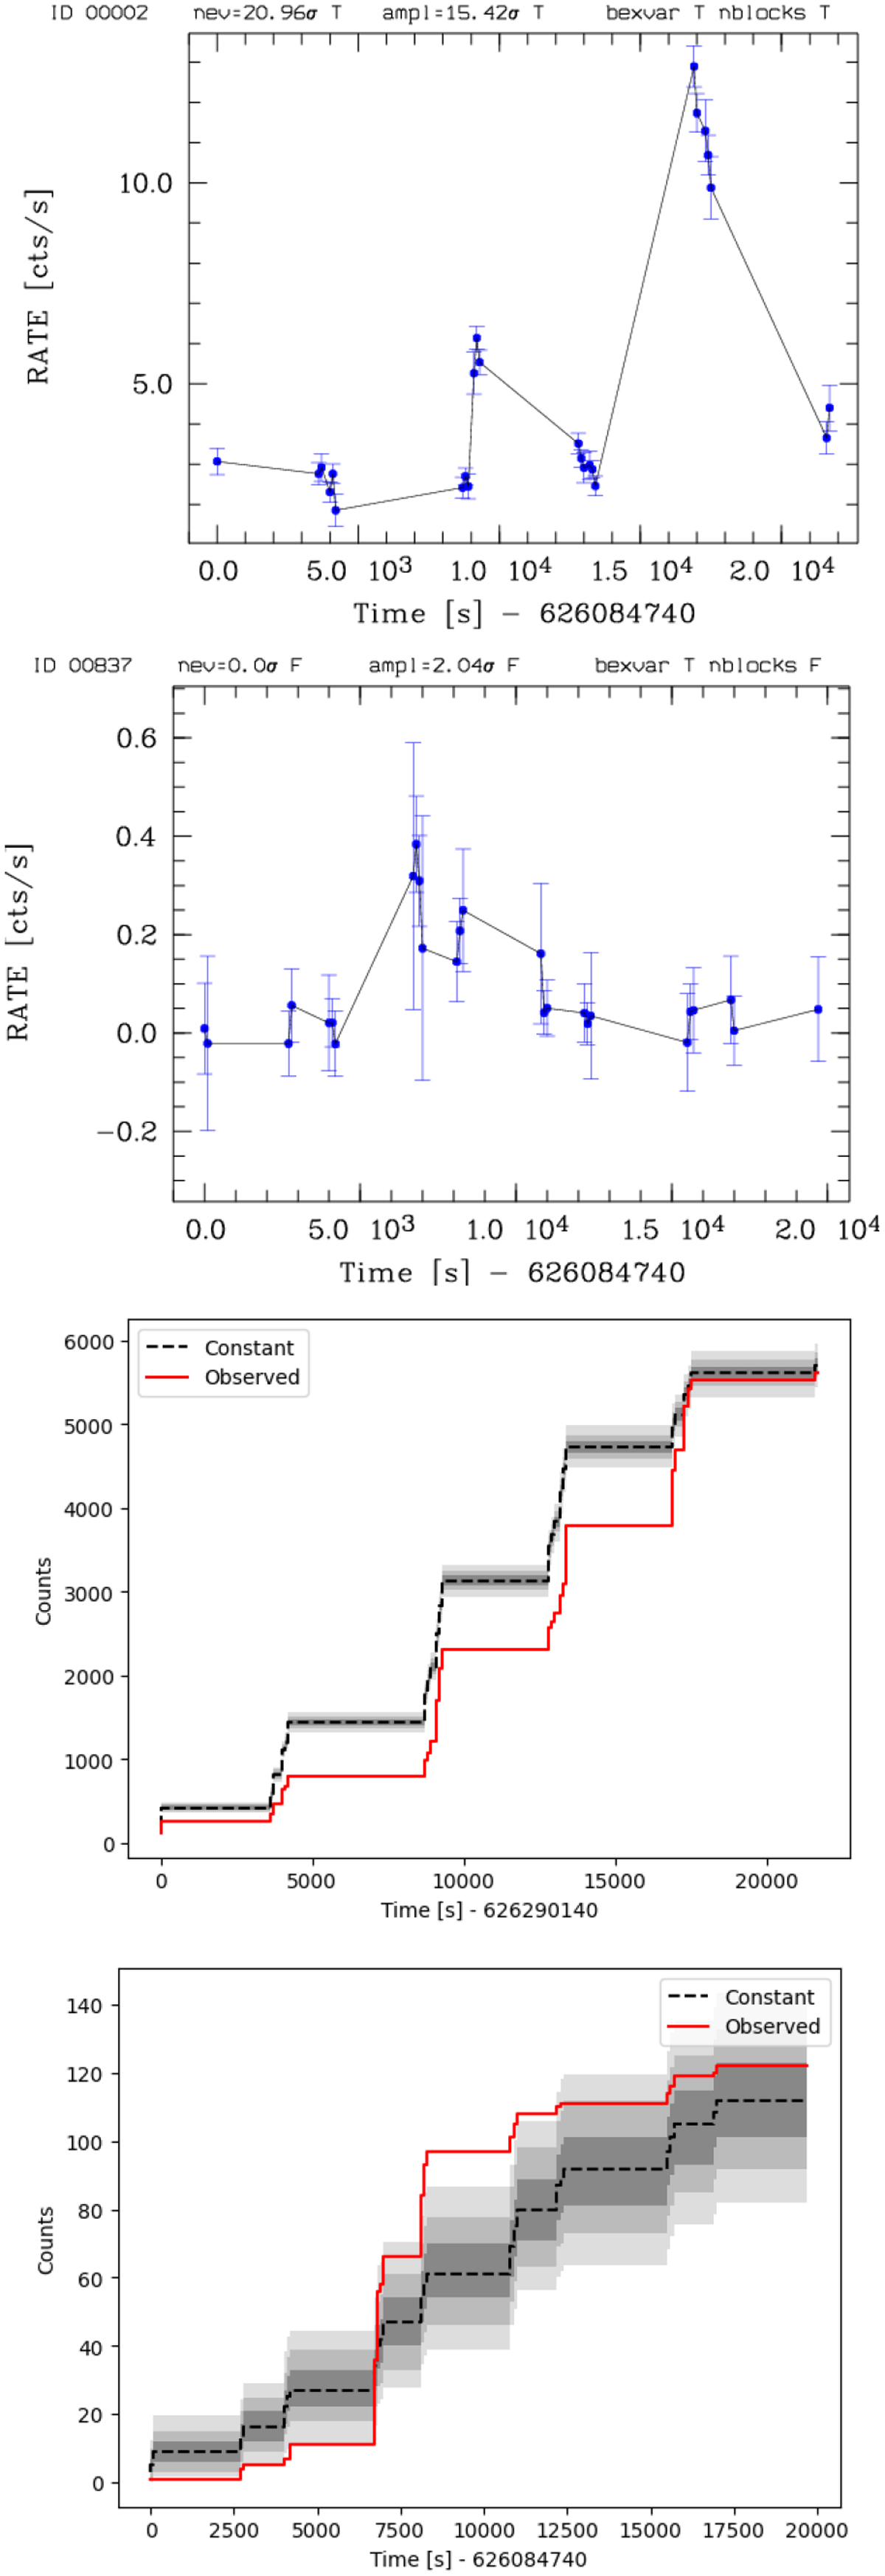
Light curves (top two panels) and cumulative count plots (lower two panels) for two eFEDS sources (source IDs 2 and 837). The grey shadowed areas in the cumulative plots indicate count rate deviations of 1, 2, and 3σ with respect to a constant count rate per cumulative time bin.
Current usage metrics show cumulative count of Article Views (full-text article views including HTML views, PDF and ePub downloads, according to the available data) and Abstracts Views on Vision4Press platform.
Data correspond to usage on the plateform after 2015. The current usage metrics is available 48-96 hours after online publication and is updated daily on week days.
Initial download of the metrics may take a while.