Fig. 1
Download original image
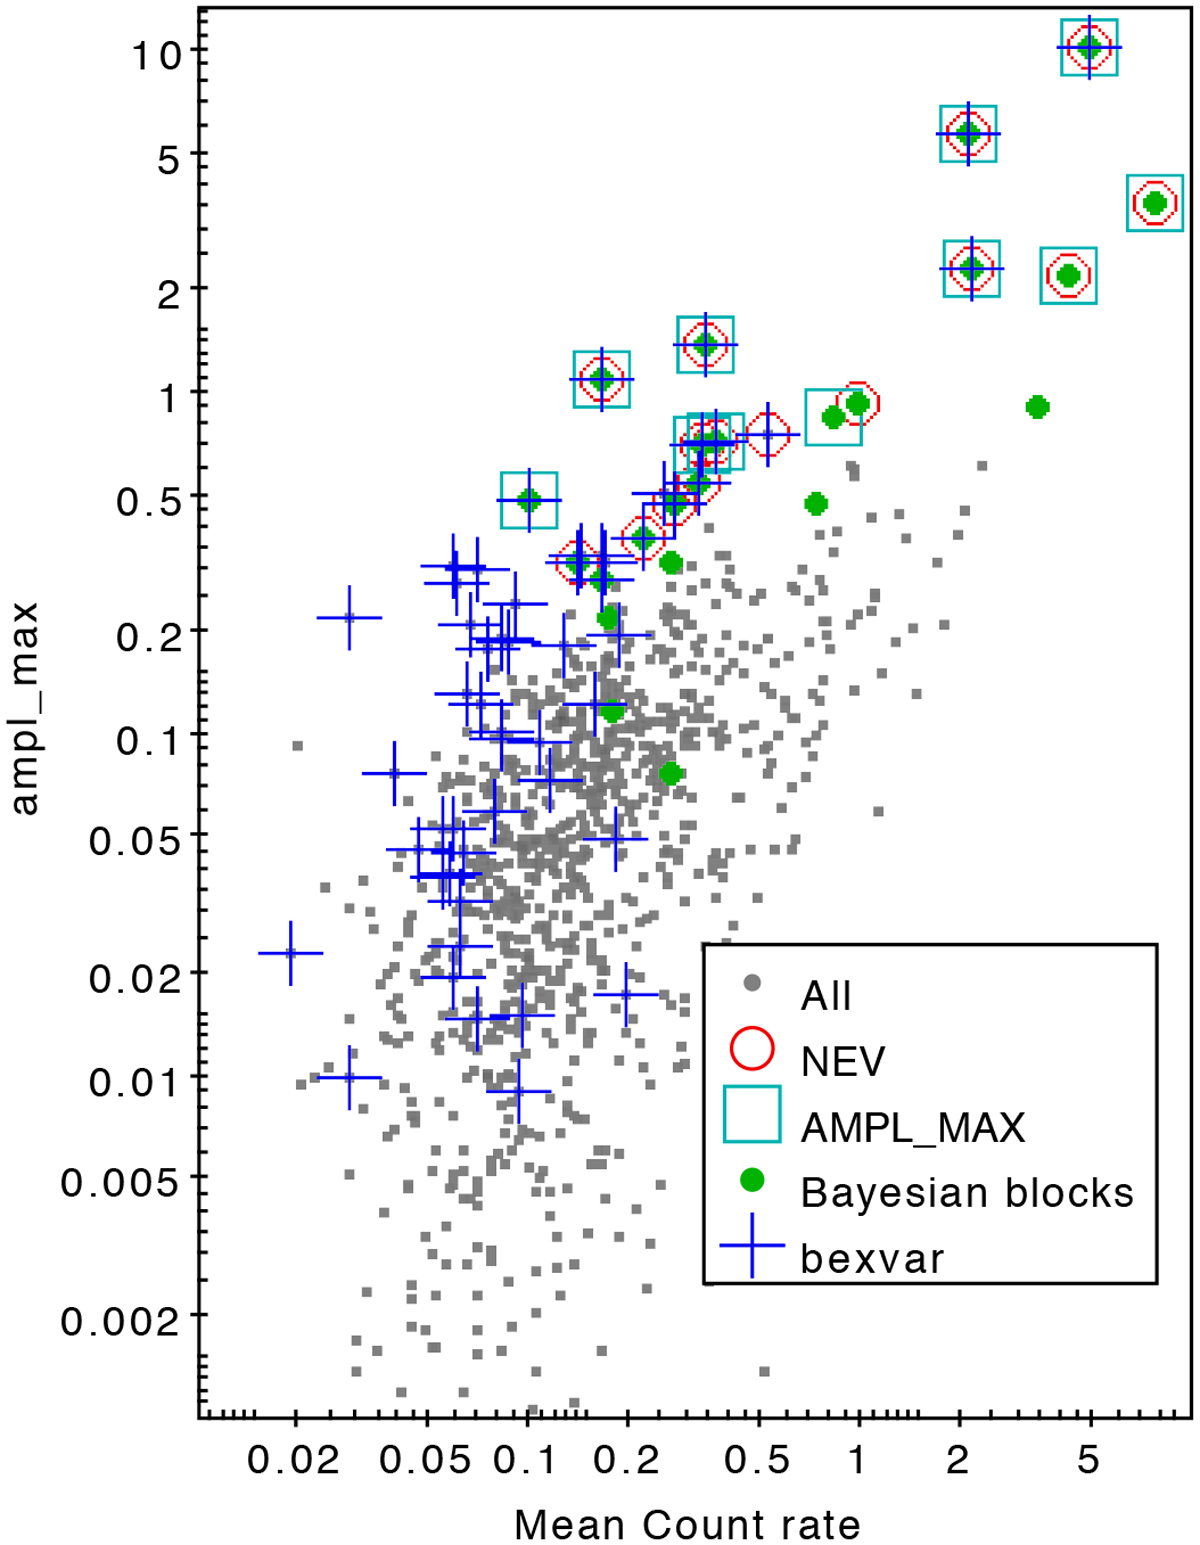
Sample distribution in mean count rate and ampl_max. For each test, the sources considered significantly variable are marked. While most of these markers are limited to the upper left corner, the blue crosses extend to the bottom left corner of the plot. This reflects the sensitivity of bexvar in the low count-rate regime.
Current usage metrics show cumulative count of Article Views (full-text article views including HTML views, PDF and ePub downloads, according to the available data) and Abstracts Views on Vision4Press platform.
Data correspond to usage on the plateform after 2015. The current usage metrics is available 48-96 hours after online publication and is updated daily on week days.
Initial download of the metrics may take a while.