Fig. 9
Download original image
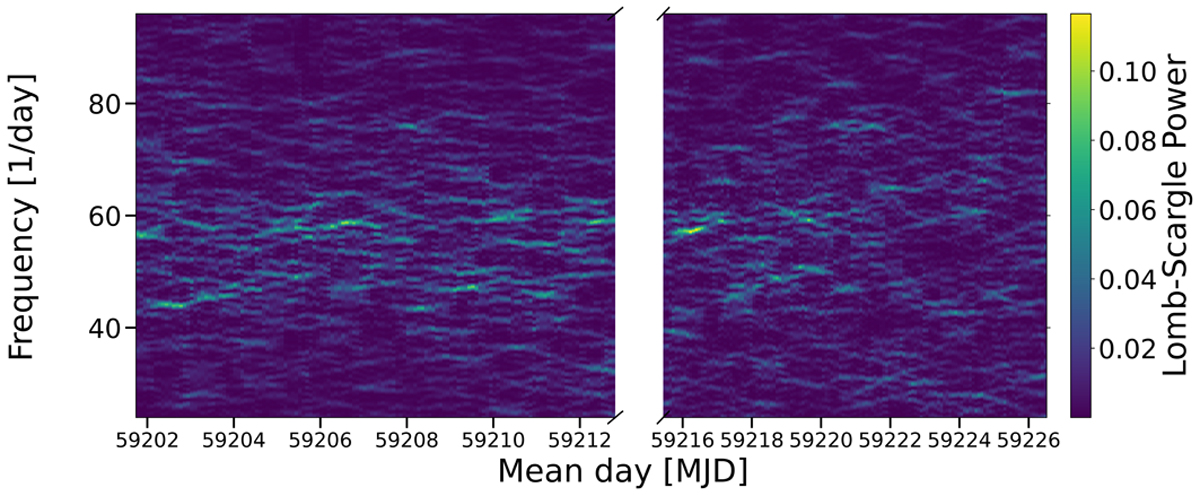
Moving-window periodogram of the TESS 2-min cadence data for a sliding window of one-day length and time steps of two hours. The x-axis is the middle of the one-day window, and the color corresponds to the Lomb-Scargle power. The broken axis corresponds to the dates around the middle of the light curve that have some missing data.
Current usage metrics show cumulative count of Article Views (full-text article views including HTML views, PDF and ePub downloads, according to the available data) and Abstracts Views on Vision4Press platform.
Data correspond to usage on the plateform after 2015. The current usage metrics is available 48-96 hours after online publication and is updated daily on week days.
Initial download of the metrics may take a while.