Fig. 15
Download original image
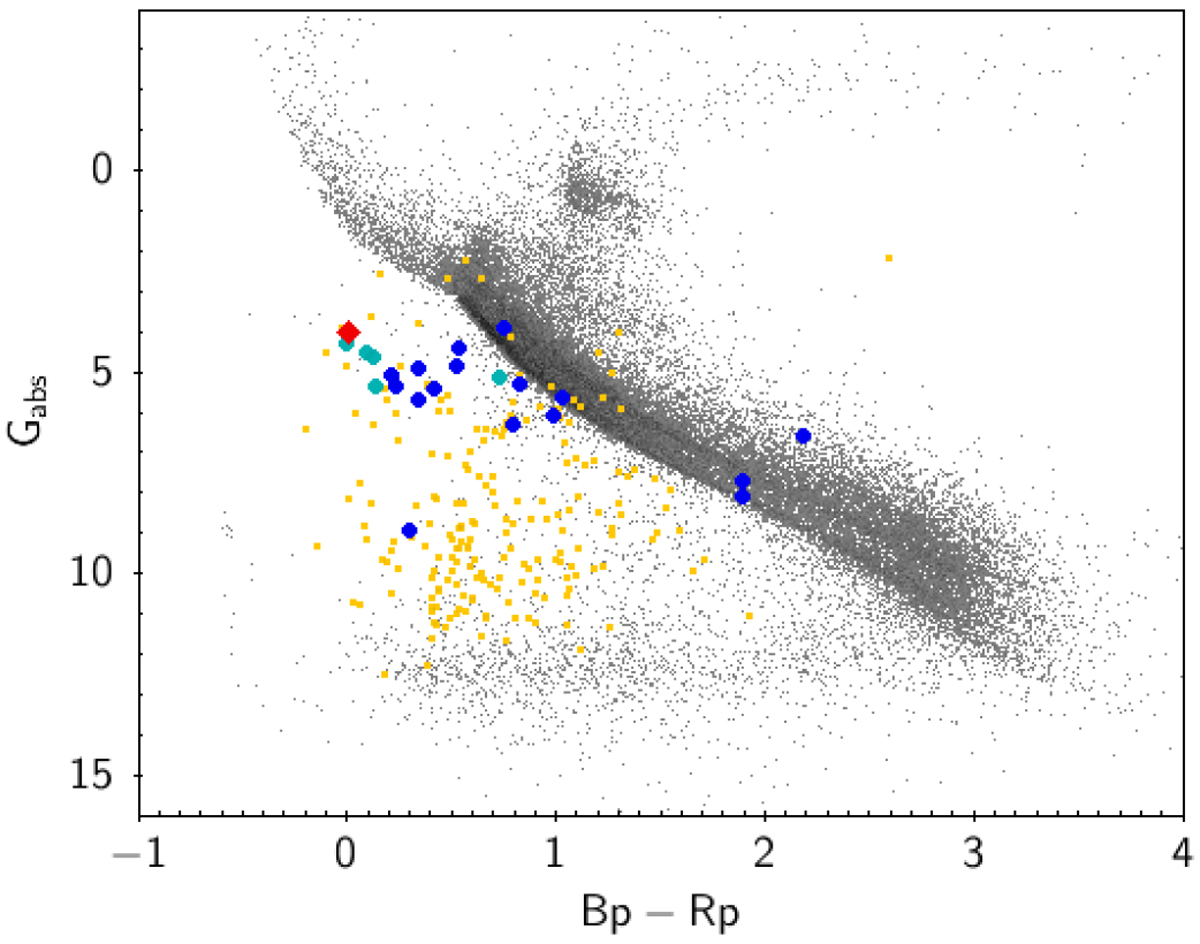
Color-magnitude diagram for eRASS2 sources. Each gray dot is an eRASS2 source that is matched (within 8 arcsec) with a Gaia source within 500 pc (distances by Bailer-Jones et al. 2018). In dark yellow we plot all CVs from the final Ritter & Kolb catalogue, in green the nonmagnetic high-accretion rate UX UMas therein, and in blue the intermediate polars from Mukai’s compilation. The new CV SRGt 062340.2–265751 is identified by the red symbol.
Current usage metrics show cumulative count of Article Views (full-text article views including HTML views, PDF and ePub downloads, according to the available data) and Abstracts Views on Vision4Press platform.
Data correspond to usage on the plateform after 2015. The current usage metrics is available 48-96 hours after online publication and is updated daily on week days.
Initial download of the metrics may take a while.