Fig. 6
Download original image
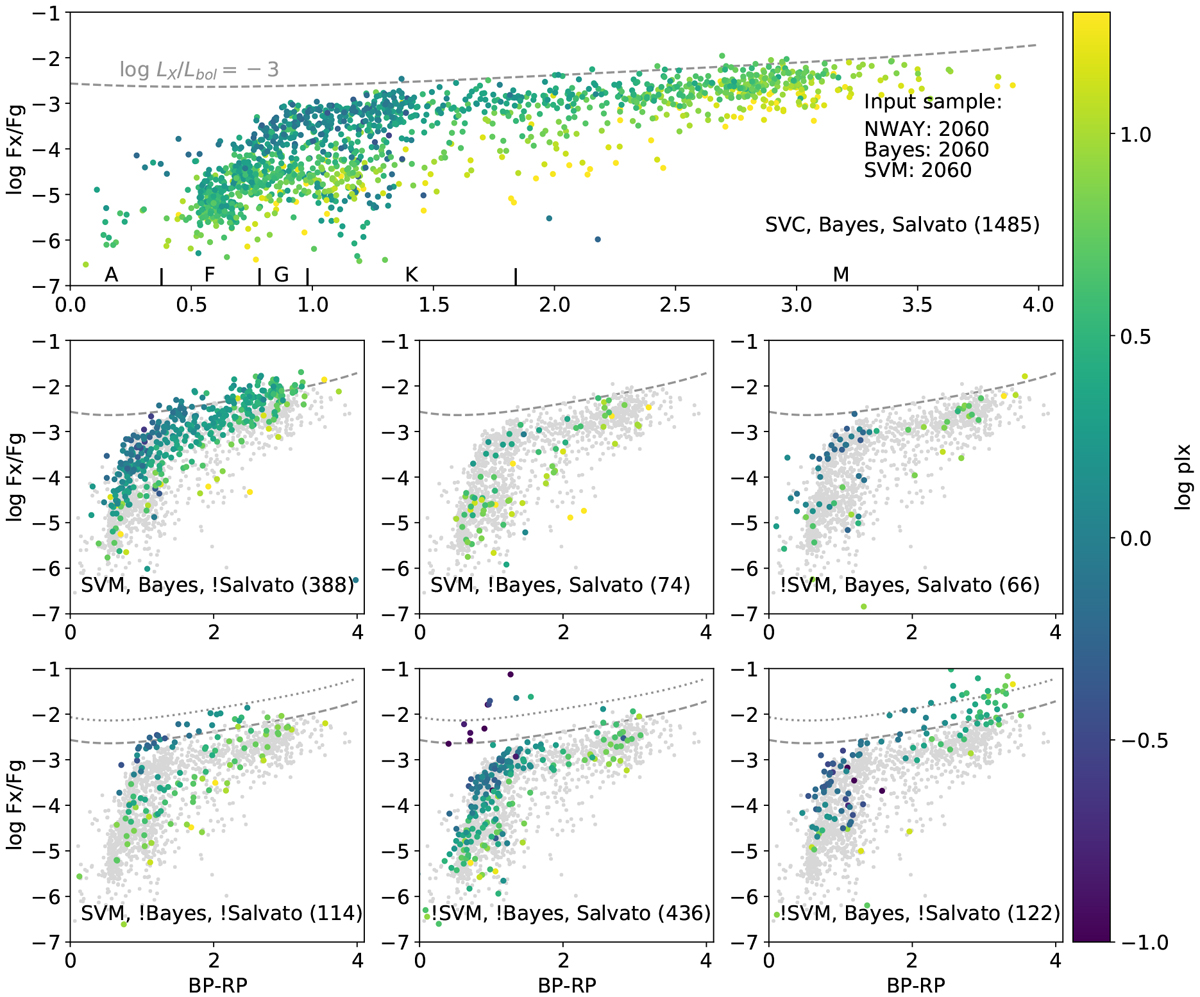
Ratio between X-ray and G-band fluxes as a function of the associated Gaia object’s BP-RP color. The objects are colored according to the parallax. The label in the lower part of all seven panels indicate in which sample the colored objects belong: SVM, Bayes, and Salvato describe the method and “!” equals not, that is, that the colored identification are not identified by the method that is preceded by the “!”. The number in bracket indicates the respective number of sources. In rows two and three, the gray dots represent the objects of the top panel for reference. The dotted line in the bottom row indicates log LX/Lbol = −2.5.
Current usage metrics show cumulative count of Article Views (full-text article views including HTML views, PDF and ePub downloads, according to the available data) and Abstracts Views on Vision4Press platform.
Data correspond to usage on the plateform after 2015. The current usage metrics is available 48-96 hours after online publication and is updated daily on week days.
Initial download of the metrics may take a while.