Fig. 2
Download original image
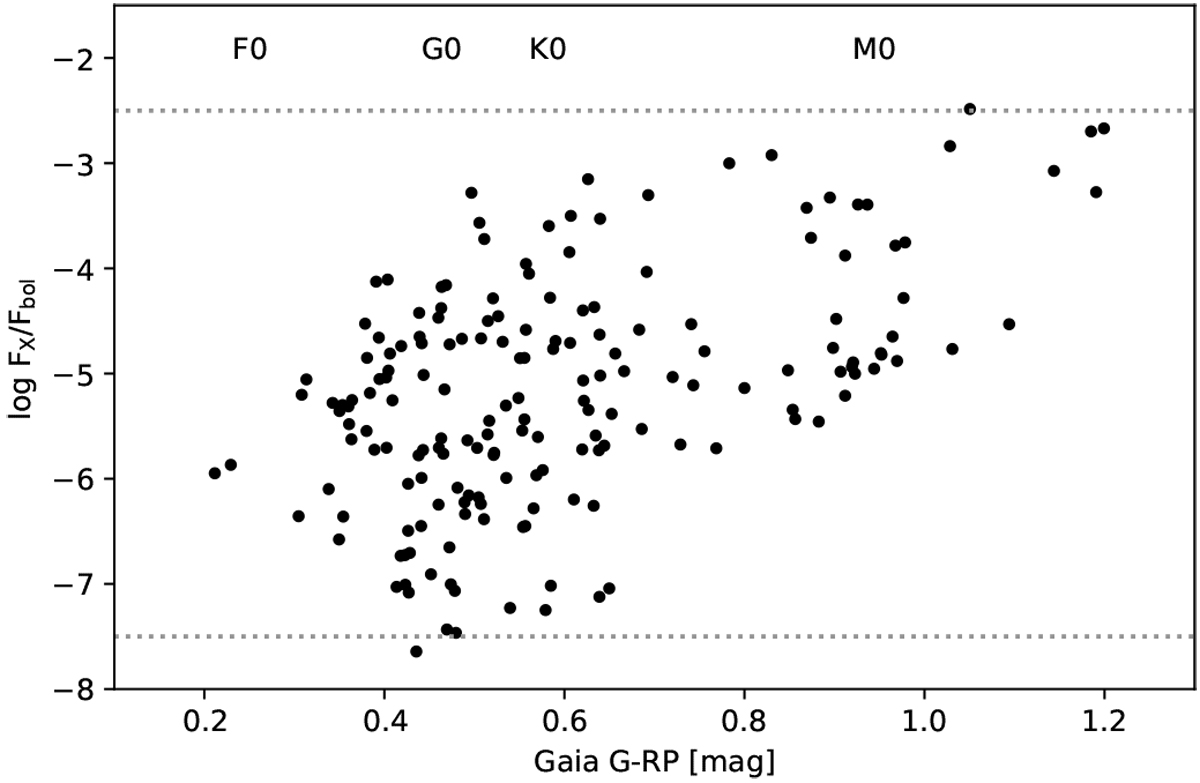
X-ray to bolometric flux ratios of the exoplanet host stars in our sample vs their Gaia colour G – Rp; corresponding spectral types are given at the top of the figure. The horizontal dotted lines indicate the approximate upper and lower boundaries of typically observed flux ratios for main-sequence stars, with which our sample agrees well.
Current usage metrics show cumulative count of Article Views (full-text article views including HTML views, PDF and ePub downloads, according to the available data) and Abstracts Views on Vision4Press platform.
Data correspond to usage on the plateform after 2015. The current usage metrics is available 48-96 hours after online publication and is updated daily on week days.
Initial download of the metrics may take a while.