Fig. 5
Download original image
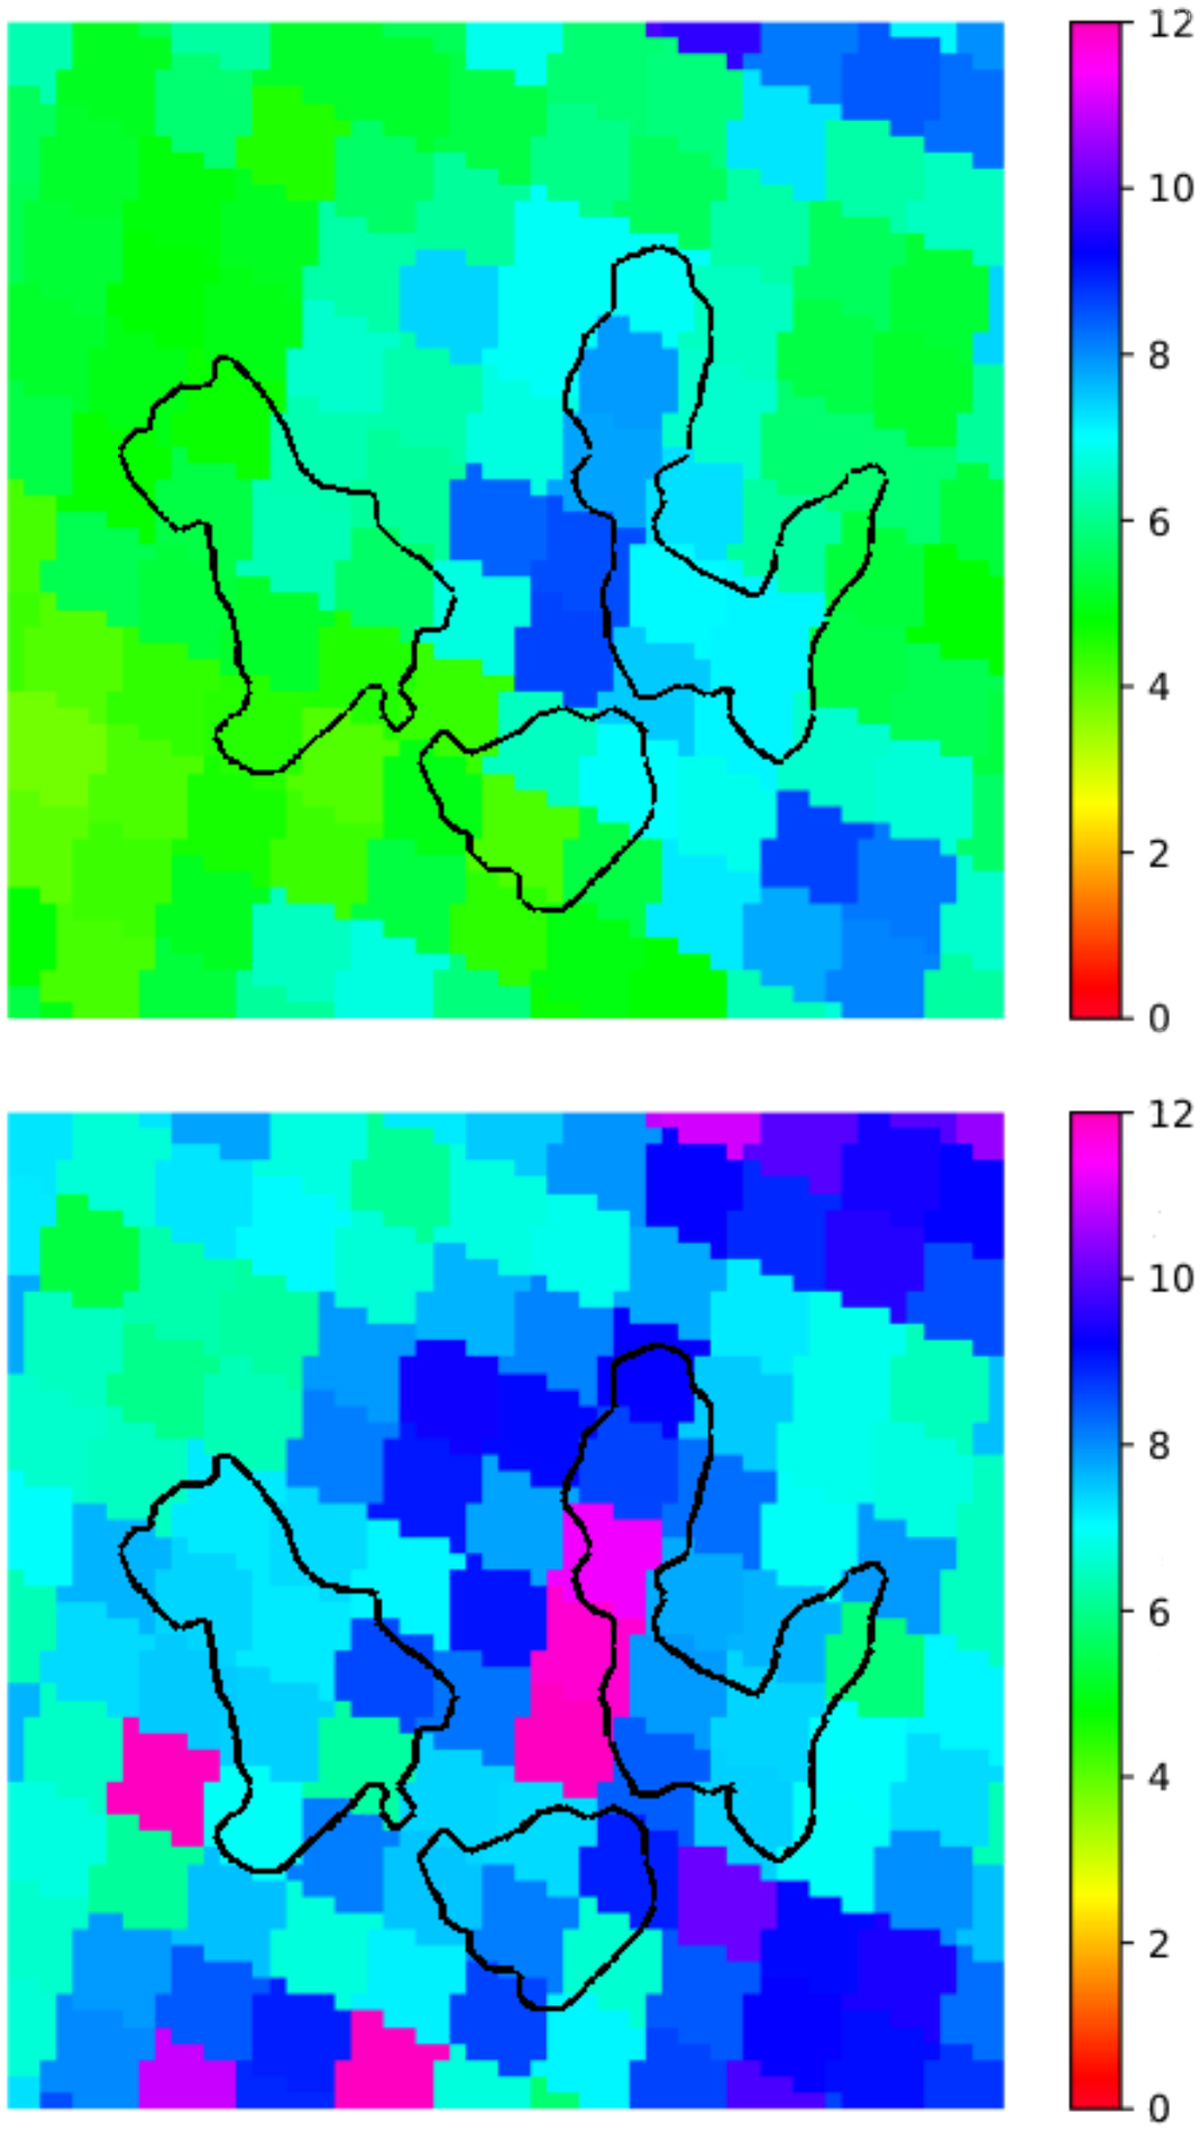
Hydrogen column density maps in the direction to SNR G18.95-1.1 derived from the bayestar19 data cubes (Green et al. 2019) using the DUSTMAPS Python package (Green 2018) for the two distances of 2 kpc (upper panel) and of 3 kpc (bottom panel). The contours of the X-ray emission as detected by SRG eROSITA in Fig. 1 are overlaid in both panels. The color-map bars show the estimated NH values in units of 1021 cm−2.
Current usage metrics show cumulative count of Article Views (full-text article views including HTML views, PDF and ePub downloads, according to the available data) and Abstracts Views on Vision4Press platform.
Data correspond to usage on the plateform after 2015. The current usage metrics is available 48-96 hours after online publication and is updated daily on week days.
Initial download of the metrics may take a while.