Fig. 4
Download original image
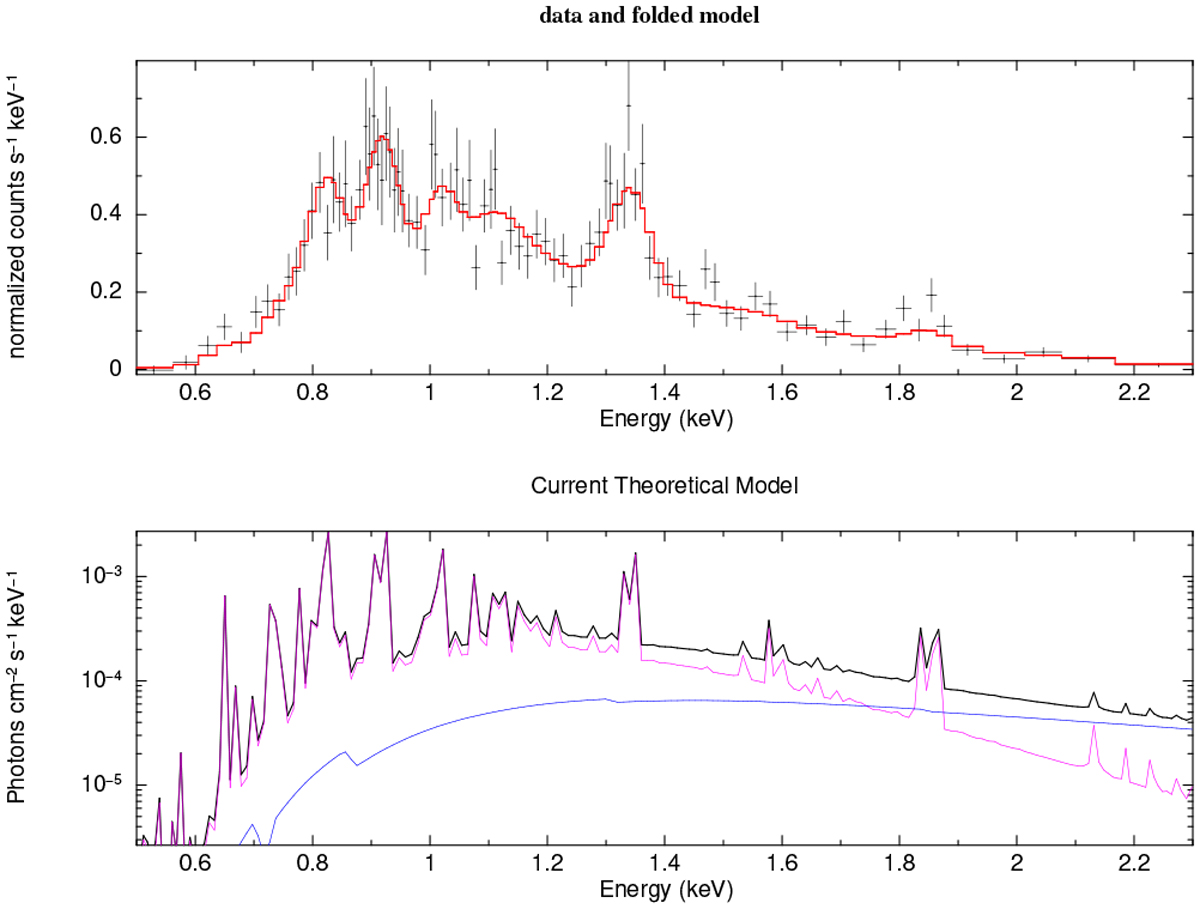
Spectrum of the PWN region. We show spectrum data (black) and the model (red) in the upper panel and the model composition in the lower panel. The entire model is shown with the black curve, and the low-temperature apec component is shown with the magenta curve. The blue curve shows the power-law component. The model spectrum parameters are listed in Table 6.
Current usage metrics show cumulative count of Article Views (full-text article views including HTML views, PDF and ePub downloads, according to the available data) and Abstracts Views on Vision4Press platform.
Data correspond to usage on the plateform after 2015. The current usage metrics is available 48-96 hours after online publication and is updated daily on week days.
Initial download of the metrics may take a while.