Fig. 2
Download original image
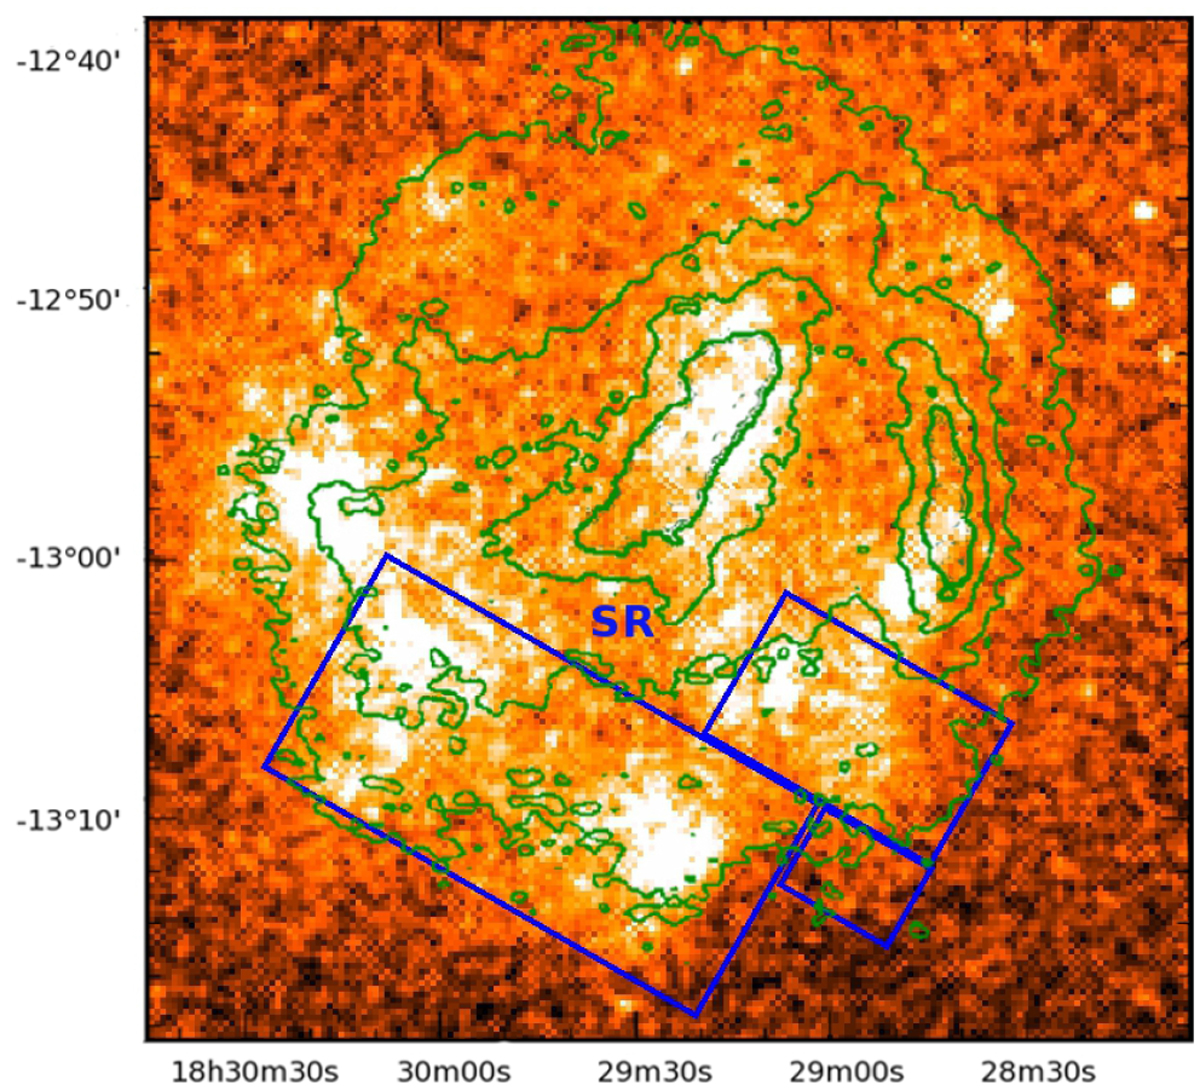
eROSITA exposure-corrected map of G18.95-1.1 with superposed green contours of the 10.55 GHz radio emission (contours by E. Fürst) from Harrus et al. (2004). The composite SR region encompassing regions box2, C3, and C4 is shown by the blue boxes.
Current usage metrics show cumulative count of Article Views (full-text article views including HTML views, PDF and ePub downloads, according to the available data) and Abstracts Views on Vision4Press platform.
Data correspond to usage on the plateform after 2015. The current usage metrics is available 48-96 hours after online publication and is updated daily on week days.
Initial download of the metrics may take a while.