Fig. 1
Download original image
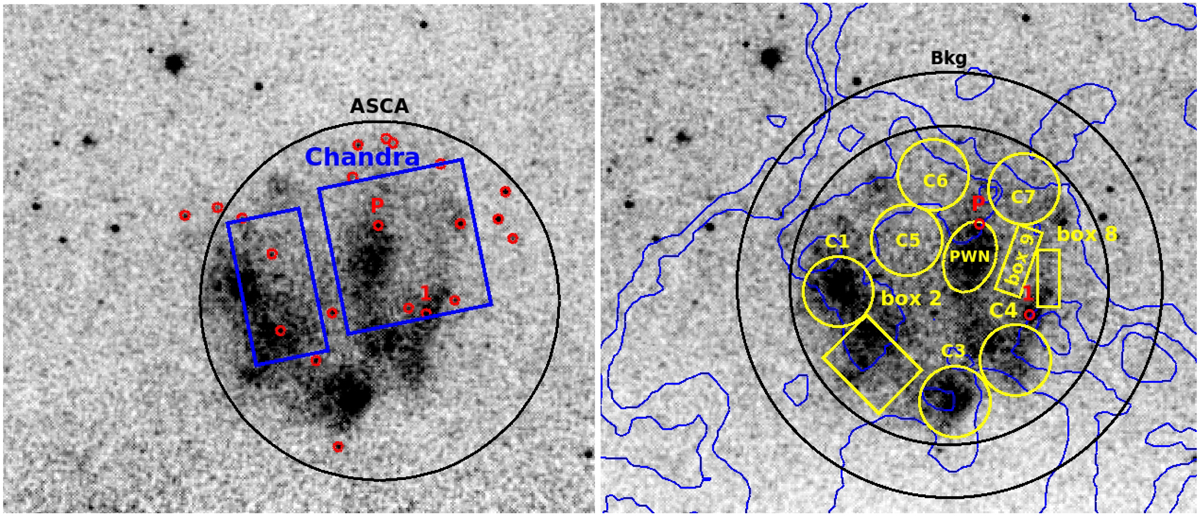
eROSITA exposure-corrected map of G18.95-1.1 and its surrounding area. The ASCA GIS and Chandra FOVs are shown in the left panel map in black and blue. Small red circles show the location of point sources that are excluded from the spectral analysis. The brightest point source is marked with a 1, and the pulsar candidate source is marked with a P. Hα contours from the SHASSA survey (Gaustad et al. 2001), shown as blue curves, are superposed in the right panel map together with the regions we used for the spectrum analysis. The annulus we used to obtain the background spectrum is shown in black. Its inner boundary is the outer border for the SNR source region. Smaller regions that were used to extract spectra of various parts of the remnant are shown in yellow, and the brightest point source and pulsar candidate are marked in red.
Current usage metrics show cumulative count of Article Views (full-text article views including HTML views, PDF and ePub downloads, according to the available data) and Abstracts Views on Vision4Press platform.
Data correspond to usage on the plateform after 2015. The current usage metrics is available 48-96 hours after online publication and is updated daily on week days.
Initial download of the metrics may take a while.