Fig. 7.
Download original image
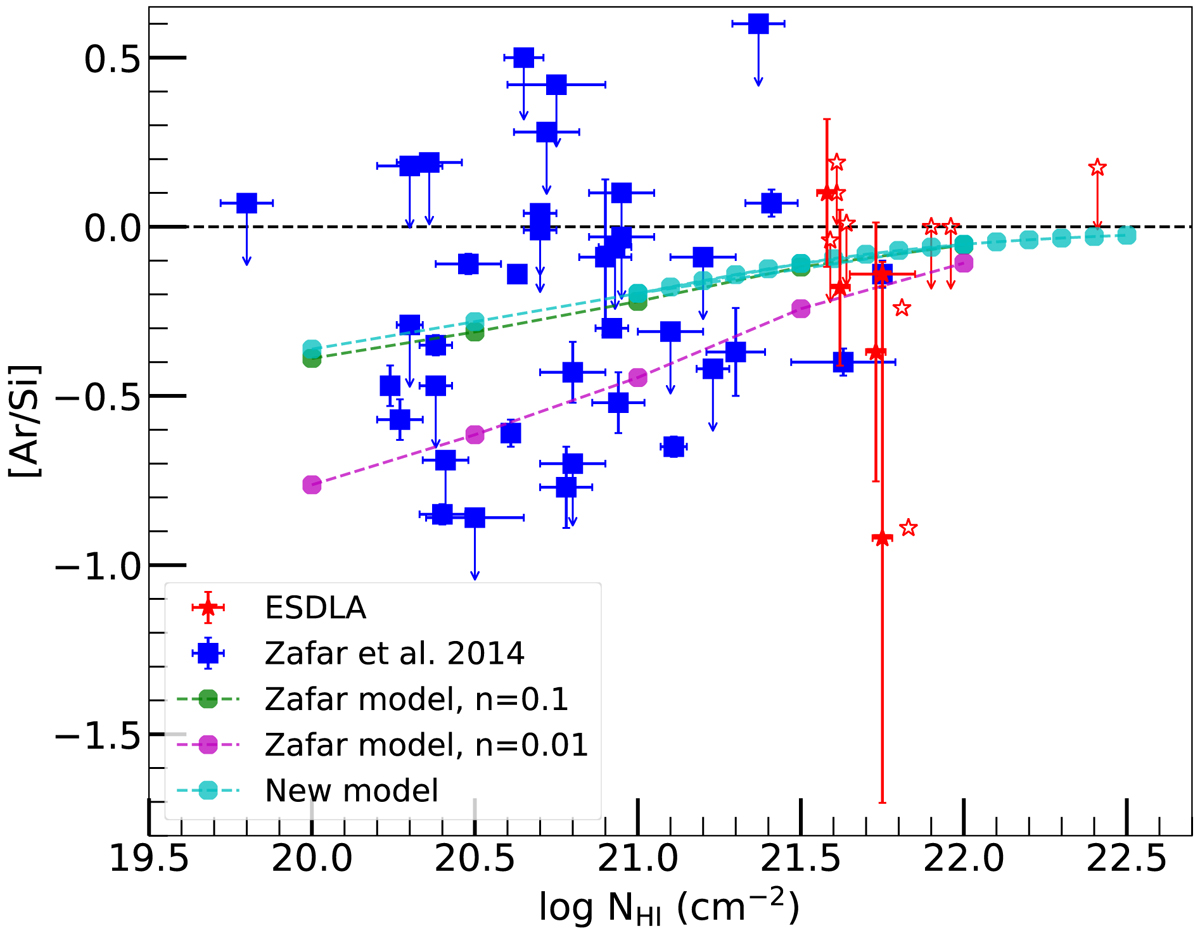
Ratio of neutral argon Ar I to Si II column density (relative to solar), [Ar/Si], plotted as a function of the H I column density. Red stars indicate measurements for ESDLAs from this work, with empty stars indicating tentative detections of Ar I and down arrows representing upper limits. Blue squares are measurements for DLAs from Zafar et al. (2014). The green dots represent a series of photoionisation models run by Zafar et al. (2014) for gas with a solar abundance ratio, low density (nH = 0.1 atoms cm−3), and Haardt & Madau (HM) extragalactic background radiation (see Haardt & Madau 2012) at z = 2.5. The purple dots also represent similar models, but with a lower density (nH = 0.01 atoms cm−3). The cyan points are a series of photo-ionisation models from this work with an updated Khaire & Srianand extragalactic background radiation field (see Khaire & Srianand 2019) and the cosmic microwave background (CMB) at redshift, z = 2.5, solar abundance ratios, log N(H I) ranging from 20 to 22.5, a metallicity of [Zn/H]∼0.05 solar (average ESDLA metallicity), and a density, nH = 0.1 cm−3. The photoionisation model results were obtained using CLOUDY.
Current usage metrics show cumulative count of Article Views (full-text article views including HTML views, PDF and ePub downloads, according to the available data) and Abstracts Views on Vision4Press platform.
Data correspond to usage on the plateform after 2015. The current usage metrics is available 48-96 hours after online publication and is updated daily on week days.
Initial download of the metrics may take a while.