Fig. 5.
Download original image
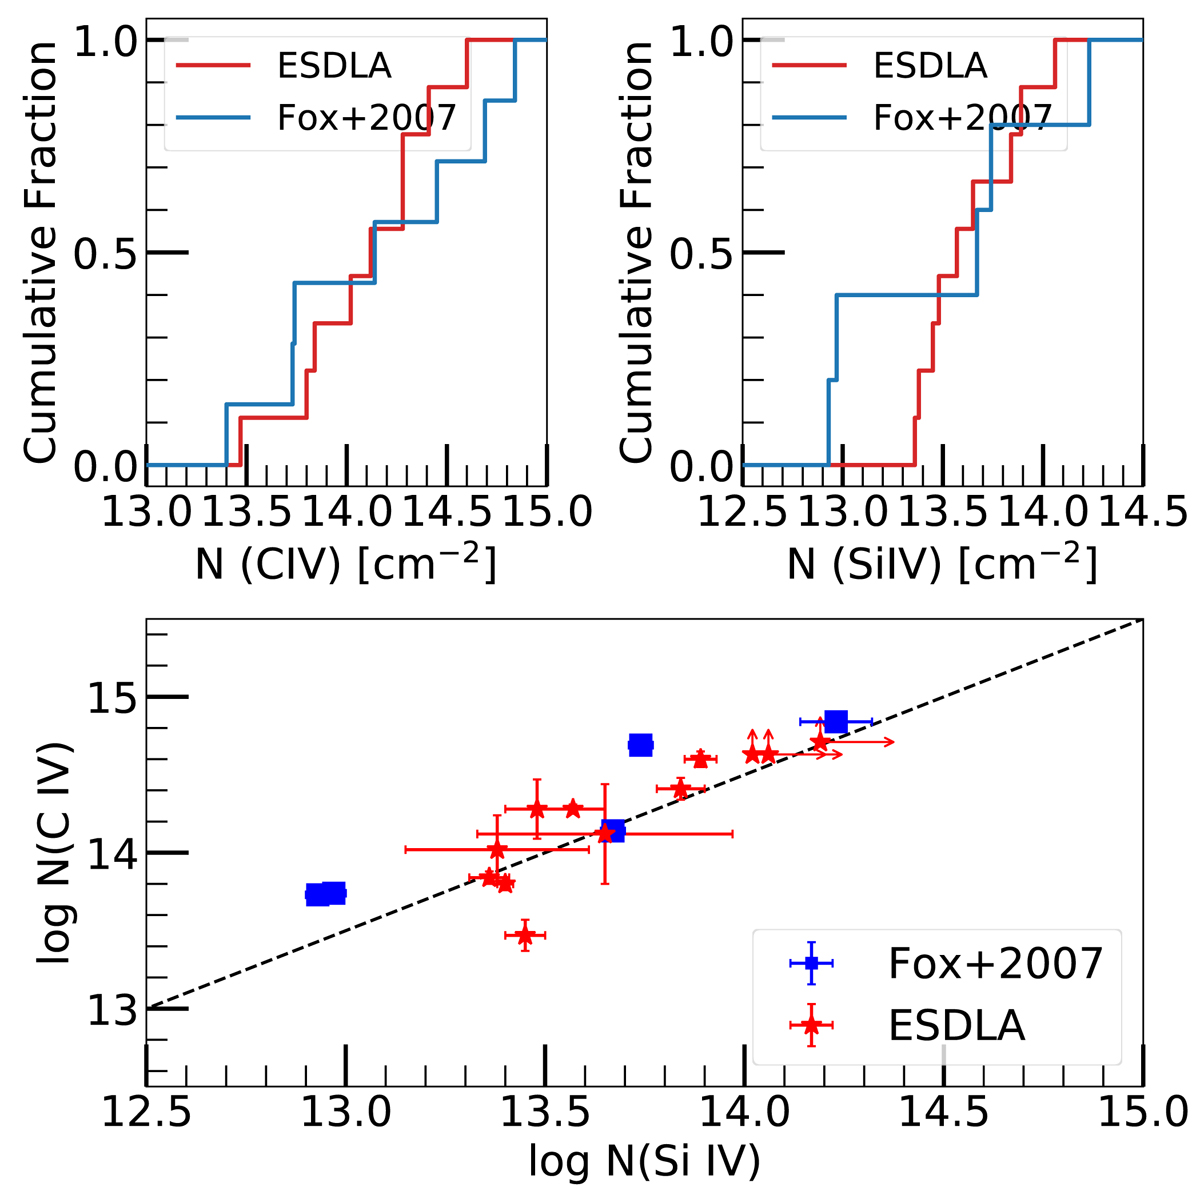
N(C IV) distribution. Top left panel: log N(C IV) cumulative distributions for the general DLA population (blue line, from Fox et al. 2007) and ESDLAs (red line). Top right panel: same for the log N(Si IV) distributions. Bottom panel: log N(C IV) vs. log N(Si IV) for ESDLAs (red points) and DLAs (blue points, taken from Fox et al. 2007). The straight line indicates log(N(C IV)) = log(N(Si IV)) + 0.5.
Current usage metrics show cumulative count of Article Views (full-text article views including HTML views, PDF and ePub downloads, according to the available data) and Abstracts Views on Vision4Press platform.
Data correspond to usage on the plateform after 2015. The current usage metrics is available 48-96 hours after online publication and is updated daily on week days.
Initial download of the metrics may take a while.