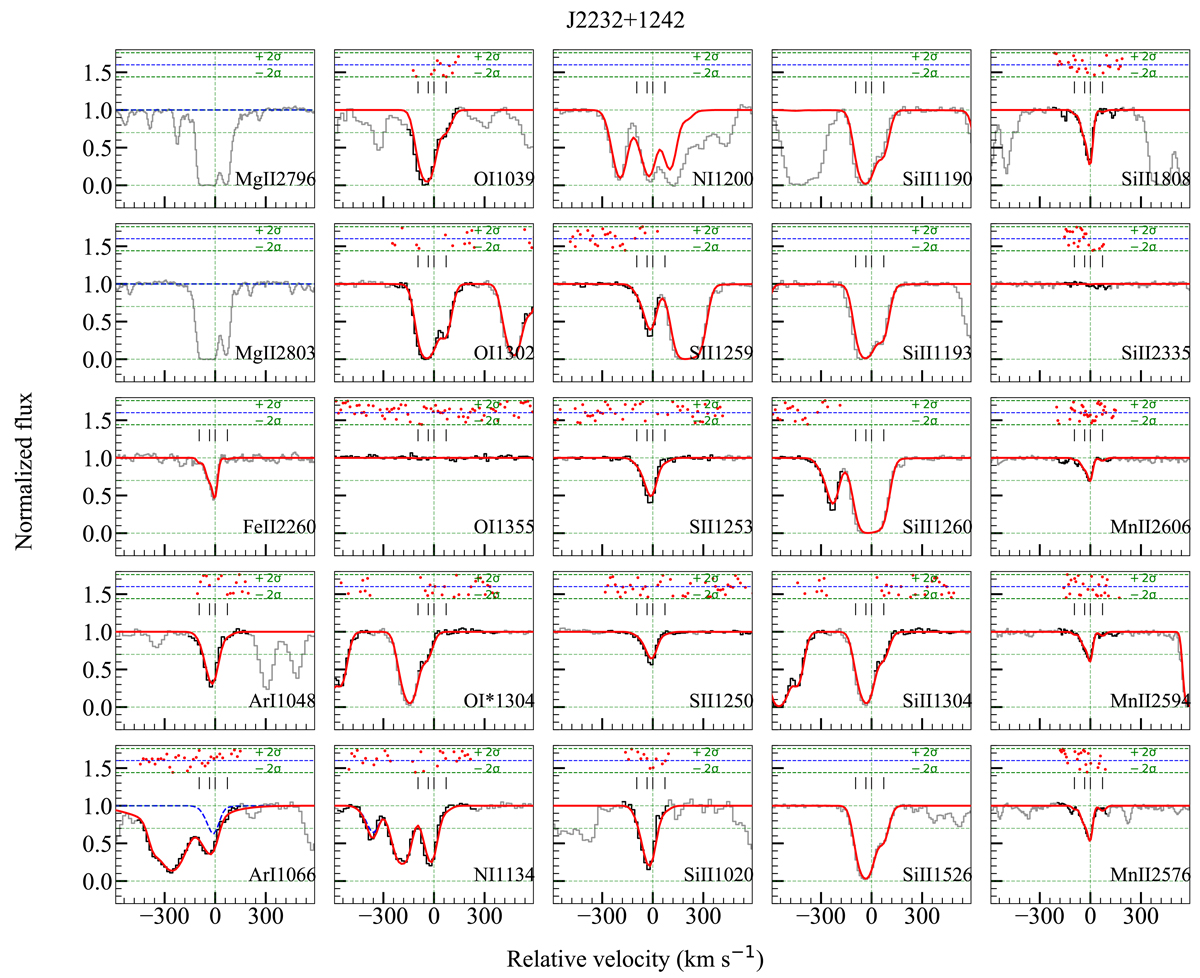
Fig. A.11.
Download original image
Different ionisation metal lines (Mg II, Fe II, Ar I, O I O I*, N I, S II, Si II, and Mn II) associated with the zabs = 2.230 ESDLA system towards QSO SDSS J2232+1242. The plots show ’O I λ1302’ and ’O I* λ1304’. The subplots showing ’Ar I λ1066’ and ’N I λ1134’ transitions have contamination from the Lyα forest that were included while fitting. The legends as well as the assumption on sub-component redshifts and b-values are the same as in Fig. A.1.
Current usage metrics show cumulative count of Article Views (full-text article views including HTML views, PDF and ePub downloads, according to the available data) and Abstracts Views on Vision4Press platform.
Data correspond to usage on the plateform after 2015. The current usage metrics is available 48-96 hours after online publication and is updated daily on week days.
Initial download of the metrics may take a while.