Fig. 2.
Download original image
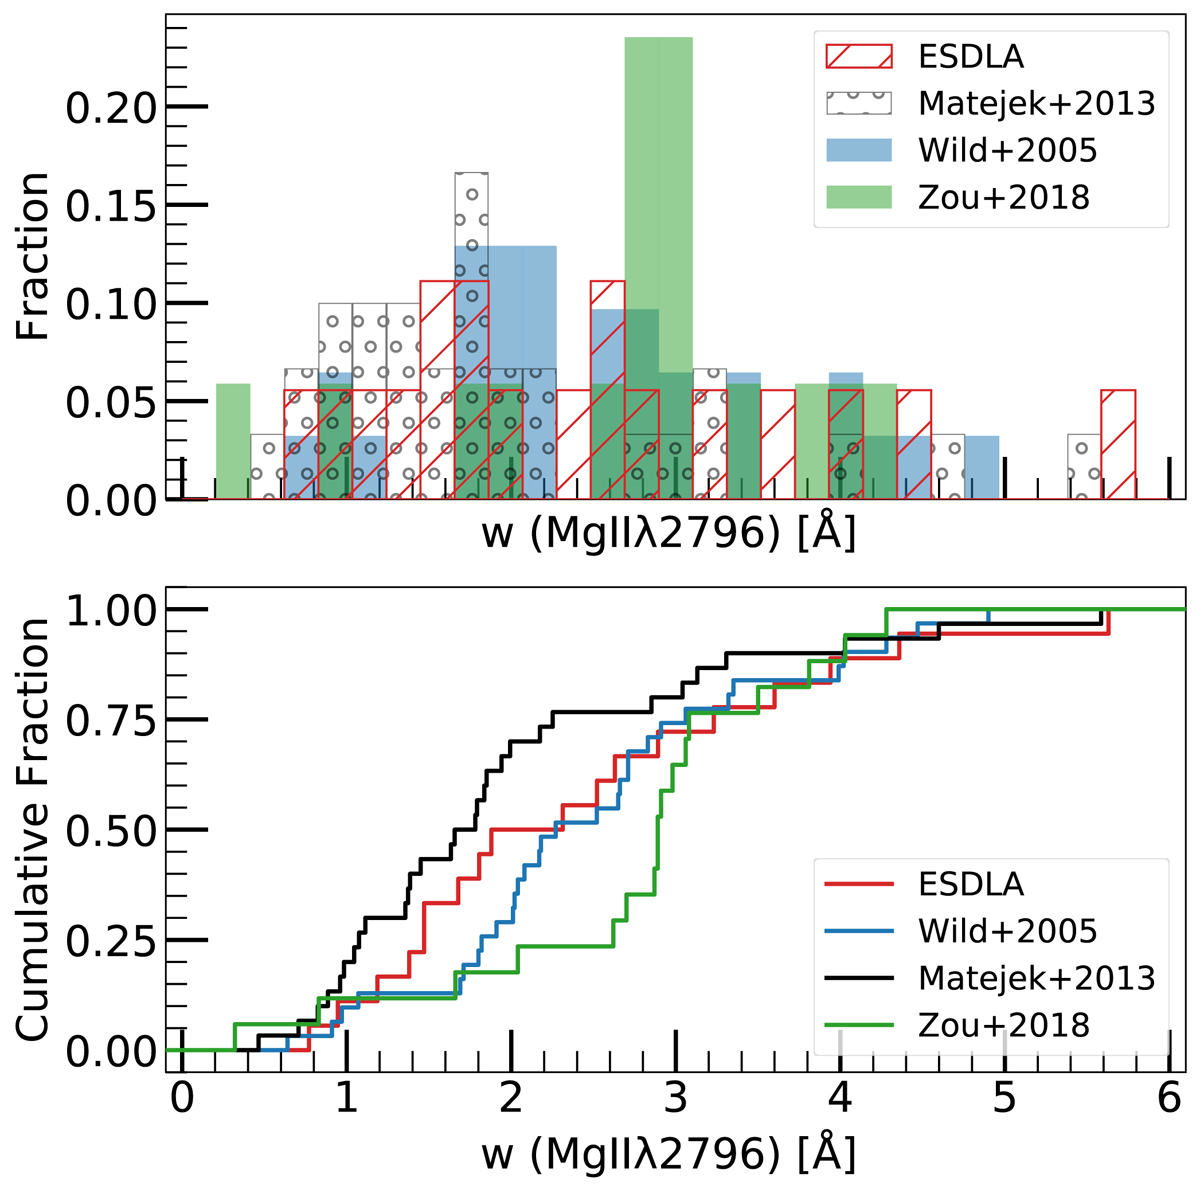
w(‘Mg II λ2796’) in different samples. Top panel: distribution of the ‘Mg II λ2796’ equivalent width (w) in the ESDLAs (red hashed histogram, this work), C I-selected absorbers (green filled histogram, from Zou et al. 2018), Ca II-selected absorbers (blue filled histogram, from Wild & Hewett 2005), and the general DLA population (grey dotted histogram, from Matejek et al. 2013). Bottom panel: cumulative distributions of the same samples using the same colours.
Current usage metrics show cumulative count of Article Views (full-text article views including HTML views, PDF and ePub downloads, according to the available data) and Abstracts Views on Vision4Press platform.
Data correspond to usage on the plateform after 2015. The current usage metrics is available 48-96 hours after online publication and is updated daily on week days.
Initial download of the metrics may take a while.