Fig. A.6.
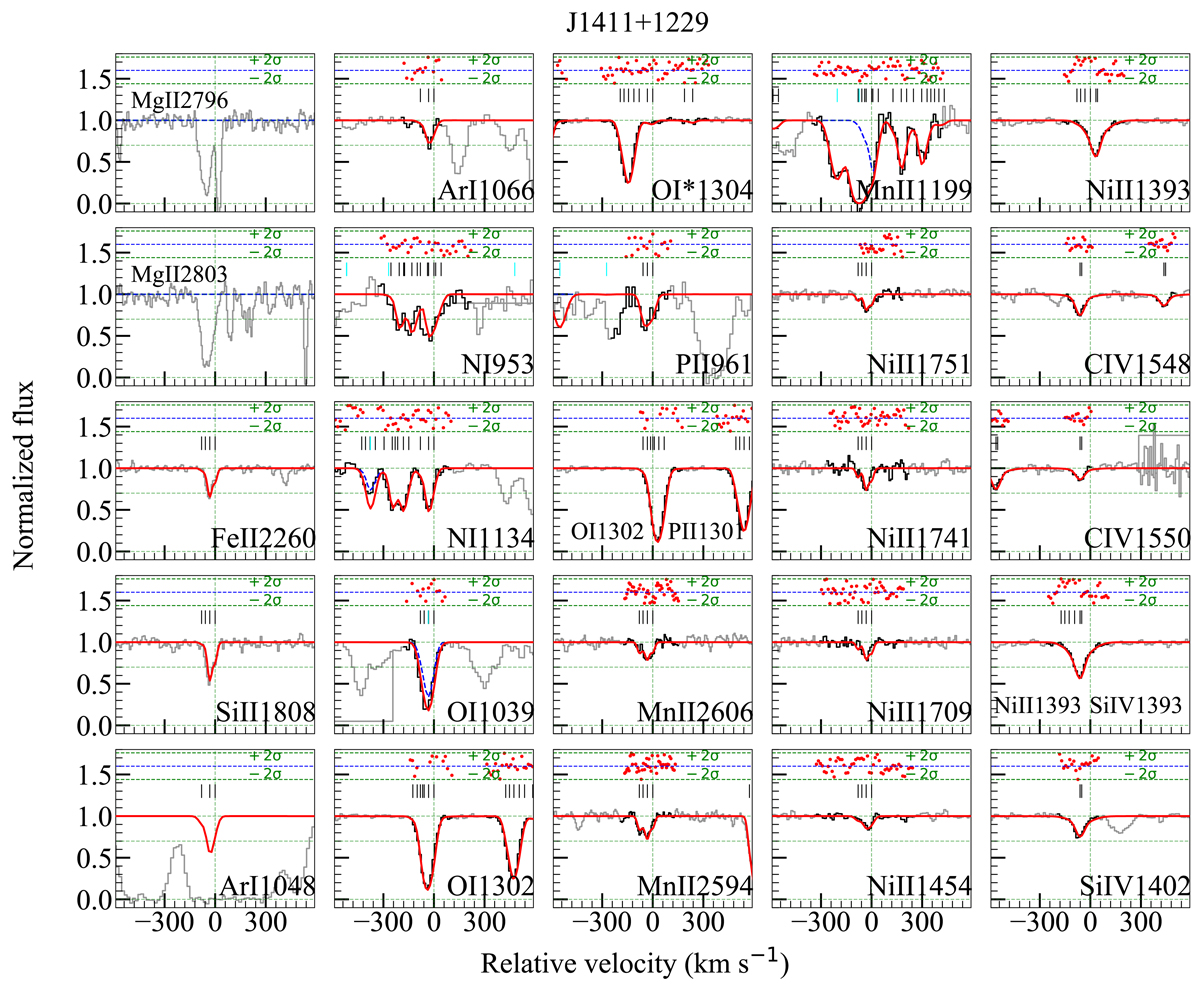
Download original image
Different ionisation metal lines (Mg II, Fe II, Si II, Ar I, N I, O I, O I*, P II, Mn II, Ni II, C IV, and Si IV) associated with the zabs = 2.545 ESDLA system towards QSO SDSS J1411+1229. The subplot with ’Ar I λ1048’ shows the mock Ar I profile on top of the spectrum, heavily contaminated with the Lyα forest and it was not used for fitting. The legends as well as the assumption on sub-component redshifts and b-values are the same as in Fig. A.1.
Current usage metrics show cumulative count of Article Views (full-text article views including HTML views, PDF and ePub downloads, according to the available data) and Abstracts Views on Vision4Press platform.
Data correspond to usage on the plateform after 2015. The current usage metrics is available 48-96 hours after online publication and is updated daily on week days.
Initial download of the metrics may take a while.