Fig. A.5.
Download original image
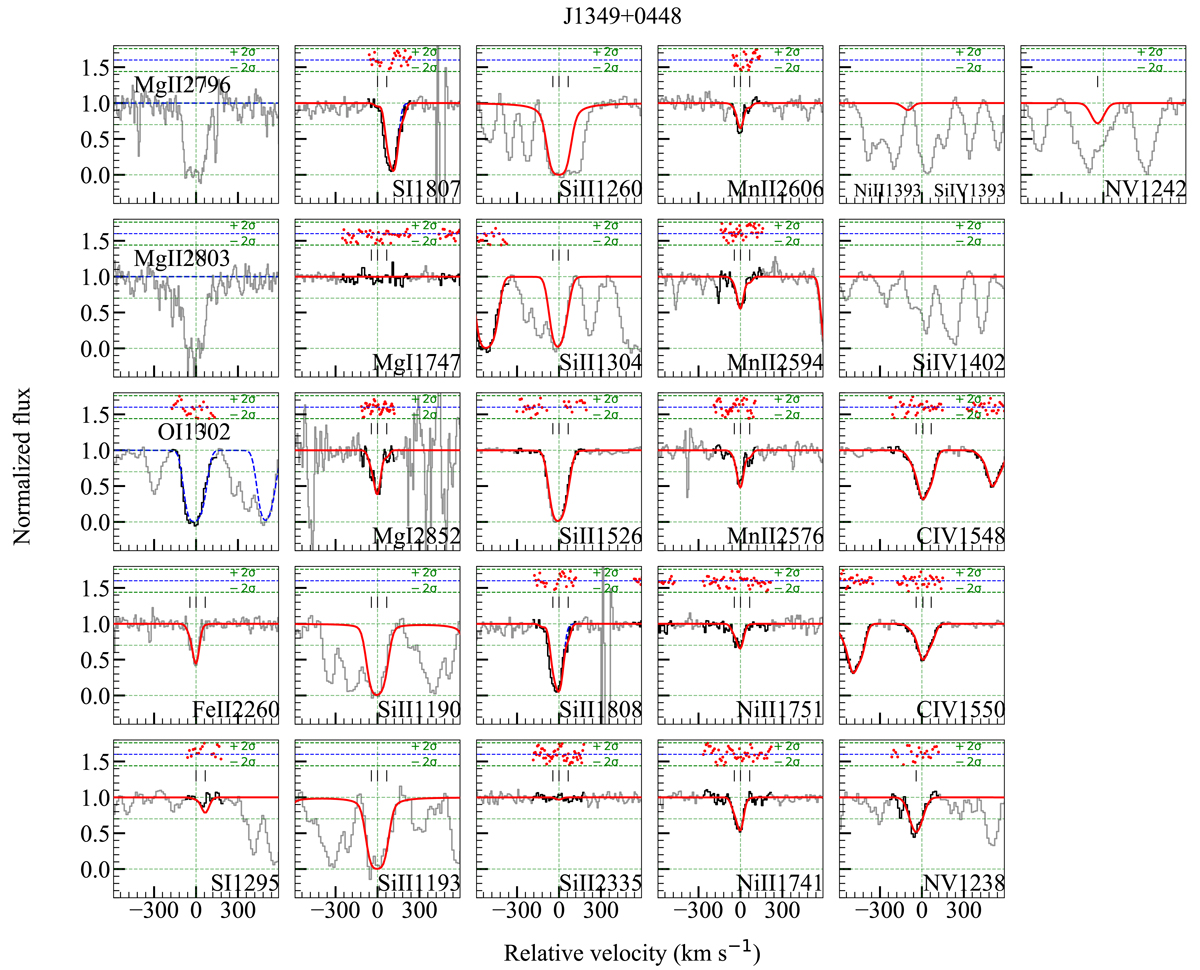
Different ionisation metal lines (Mg II, O I, Fe II, Si II, Mn II, Ni II, Si IV, C IV, and N V) associated with the zabs = 2.482 ESDLA system towards QSO SDSS J1349+0448. The sub-component redshifts and b-values of C IV and N V are also tied together. ’N V λ1242’ is contaminated and hence the transition was not used for fitting. The Si IV profiles are strongly blended and we could not find any robust solution for the column density tied with C IV. Here, we just show the unfitted spectrum for reference. The cyan tick in the ’Si II λ1526’ subplot represents a blend with an Mg II absorption system at zabs = 0.8998. The legends as well as the assumption on sub-component redshifts and b-values are the same as in Fig. A.1.
Current usage metrics show cumulative count of Article Views (full-text article views including HTML views, PDF and ePub downloads, according to the available data) and Abstracts Views on Vision4Press platform.
Data correspond to usage on the plateform after 2015. The current usage metrics is available 48-96 hours after online publication and is updated daily on week days.
Initial download of the metrics may take a while.