Fig. 11.
Download original image
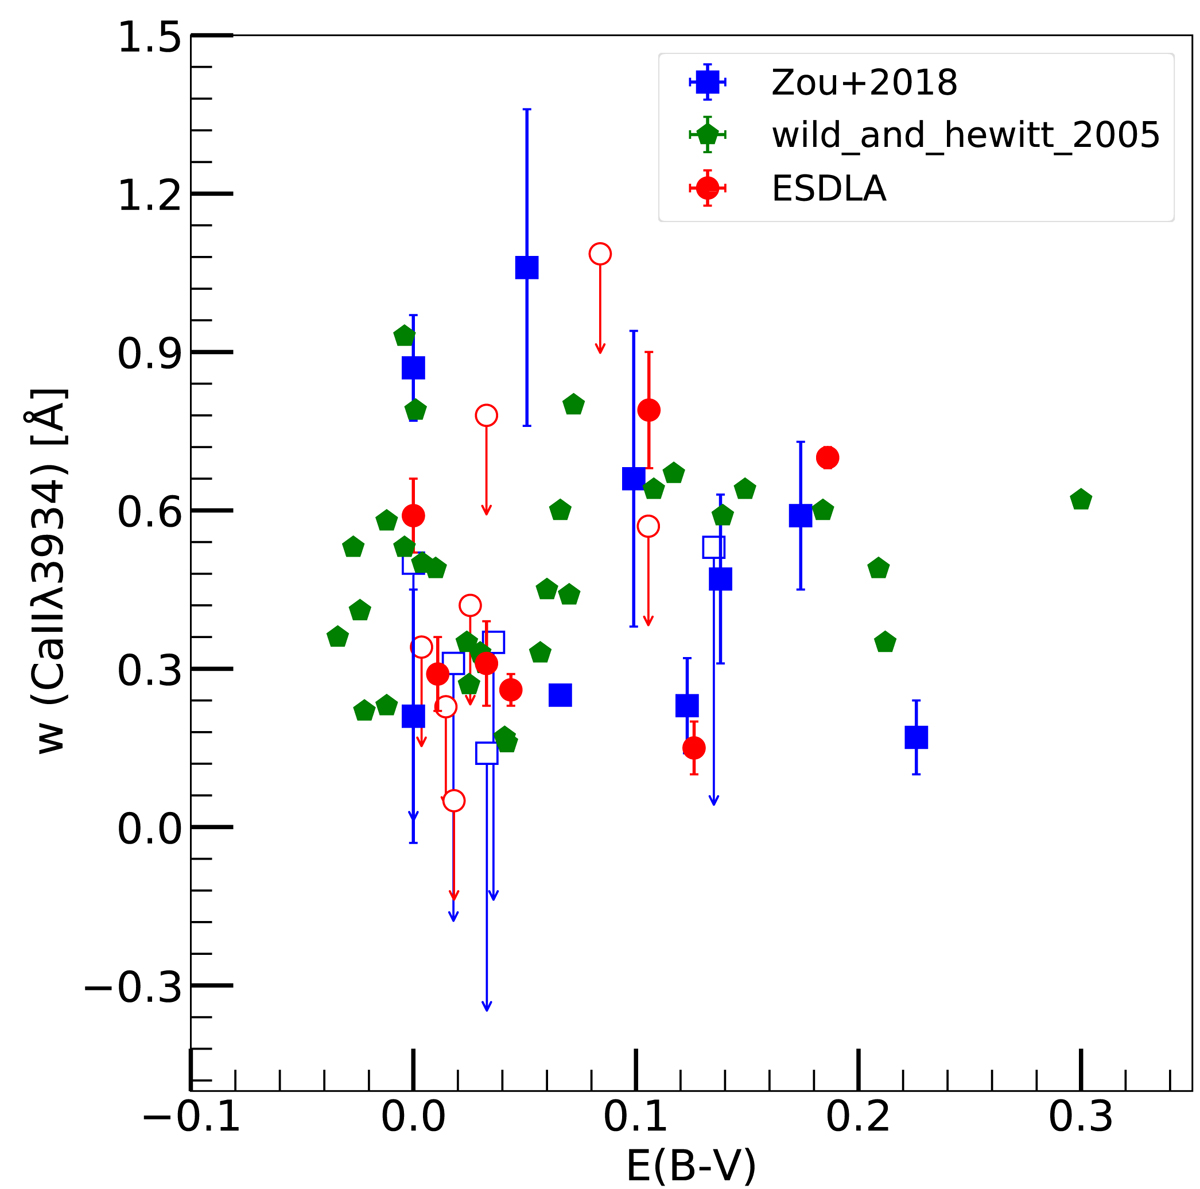
Equivalent width, w(Ca II λ3934), as a function of the colour excess E(B − V). The red circles, blue squares, and green pentagons represent the ESDLAs, as well as the C I-selected (Zou et al. 2018) and Ca II-selected (Wild & Hewett 2005) sample, respectively. The w(Ca II λ3934) upper limits are represented by a hollow shape and a down arrow.
Current usage metrics show cumulative count of Article Views (full-text article views including HTML views, PDF and ePub downloads, according to the available data) and Abstracts Views on Vision4Press platform.
Data correspond to usage on the plateform after 2015. The current usage metrics is available 48-96 hours after online publication and is updated daily on week days.
Initial download of the metrics may take a while.