Open Access
Fig. 1.
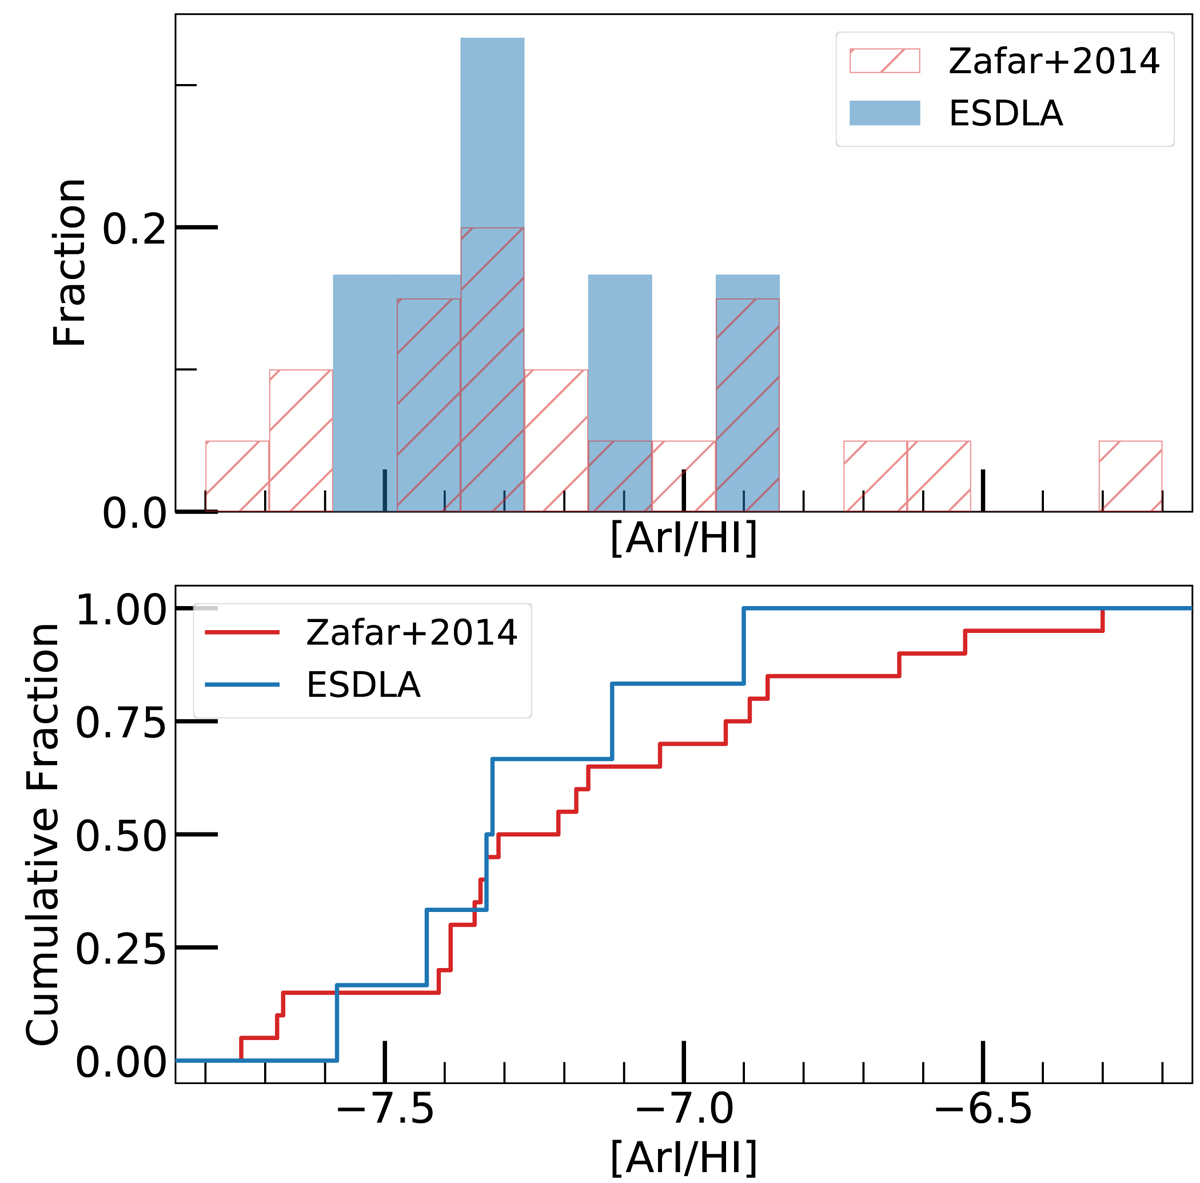
Download original image
Distributions of the column density ratio, N(Ar I)/N(H I), in ESDLAs (blue curves, this work) and the general DLA population (red curves, Zafar et al. 2014). The histogram and cumulative distributions from the two samples are compared in the top and bottom panels, respectively.
Current usage metrics show cumulative count of Article Views (full-text article views including HTML views, PDF and ePub downloads, according to the available data) and Abstracts Views on Vision4Press platform.
Data correspond to usage on the plateform after 2015. The current usage metrics is available 48-96 hours after online publication and is updated daily on week days.
Initial download of the metrics may take a while.