Fig. 6.
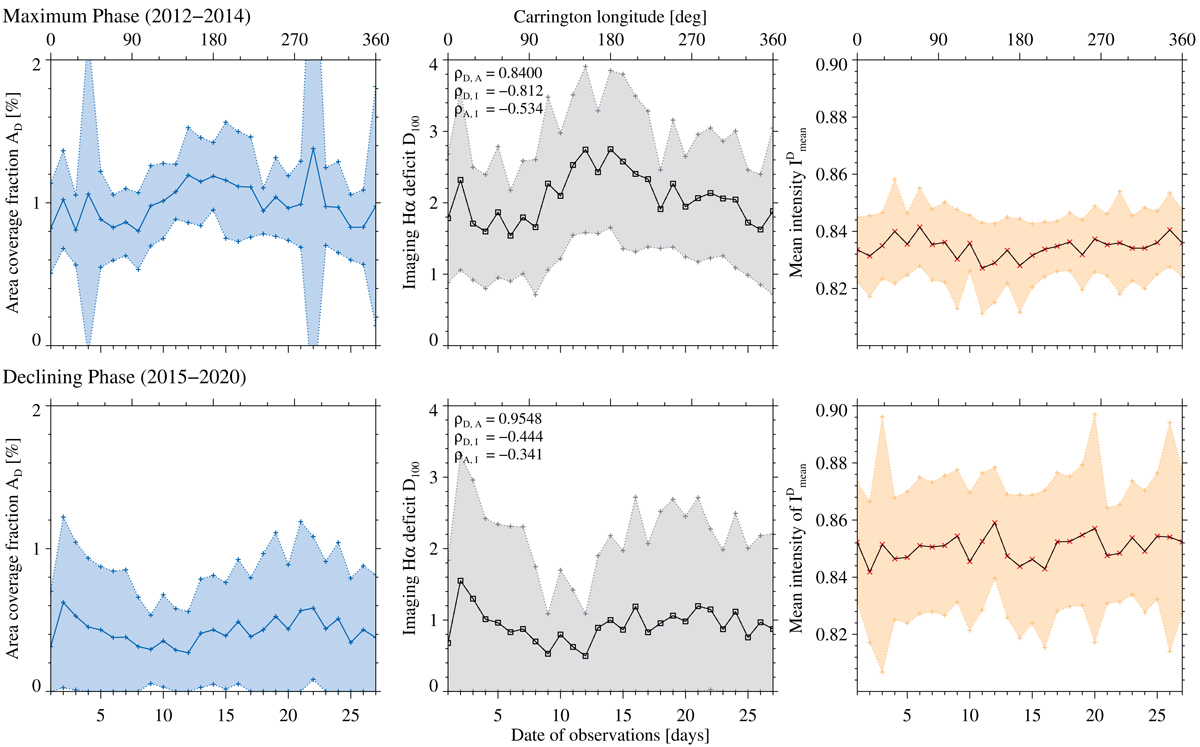
Download original image
Area coverage fraction of Hα deficit regions in percent (left row), the mean intensity of the Hα deficit regions (right row), and the imaging Hα deficit D100 (middle row) averaged for all Carrington rotations during the maximum phase of Solar Cycle 24 (upper column) and the declining phase of Solar Cycle 24 (lower column). The shaded areas indicate the standard deviation. In the middle row, we provide the Spearman correlation coefficient ρD, A of the Hα deficit and the area coverage fraction, the correlation coefficient ρD, I of the Hα deficit and the mean intensity, and the correlation coefficient of the area coverage fraction and the mean intensity ρA, I.
Current usage metrics show cumulative count of Article Views (full-text article views including HTML views, PDF and ePub downloads, according to the available data) and Abstracts Views on Vision4Press platform.
Data correspond to usage on the plateform after 2015. The current usage metrics is available 48-96 hours after online publication and is updated daily on week days.
Initial download of the metrics may take a while.