Free Access
Fig. 4.
Download original image
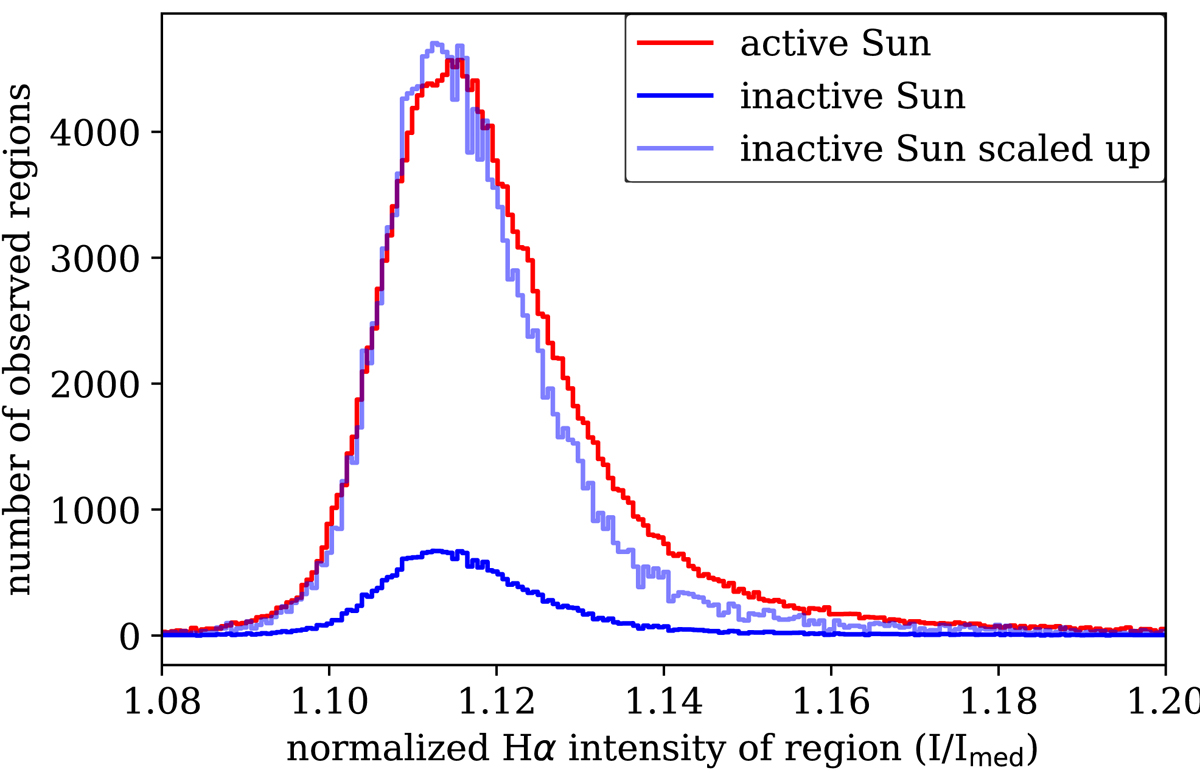
Intensity distribution of ![]() for individual regions above the threshold shown as a histogram for the active Sun (red) and the inactive Sun (blue). A scaled-up histogram of the inactive Sun is provided for an easier visual comparison with the active Sun (light blue).
for individual regions above the threshold shown as a histogram for the active Sun (red) and the inactive Sun (blue). A scaled-up histogram of the inactive Sun is provided for an easier visual comparison with the active Sun (light blue).
Current usage metrics show cumulative count of Article Views (full-text article views including HTML views, PDF and ePub downloads, according to the available data) and Abstracts Views on Vision4Press platform.
Data correspond to usage on the plateform after 2015. The current usage metrics is available 48-96 hours after online publication and is updated daily on week days.
Initial download of the metrics may take a while.