Fig. 3.
Download original image
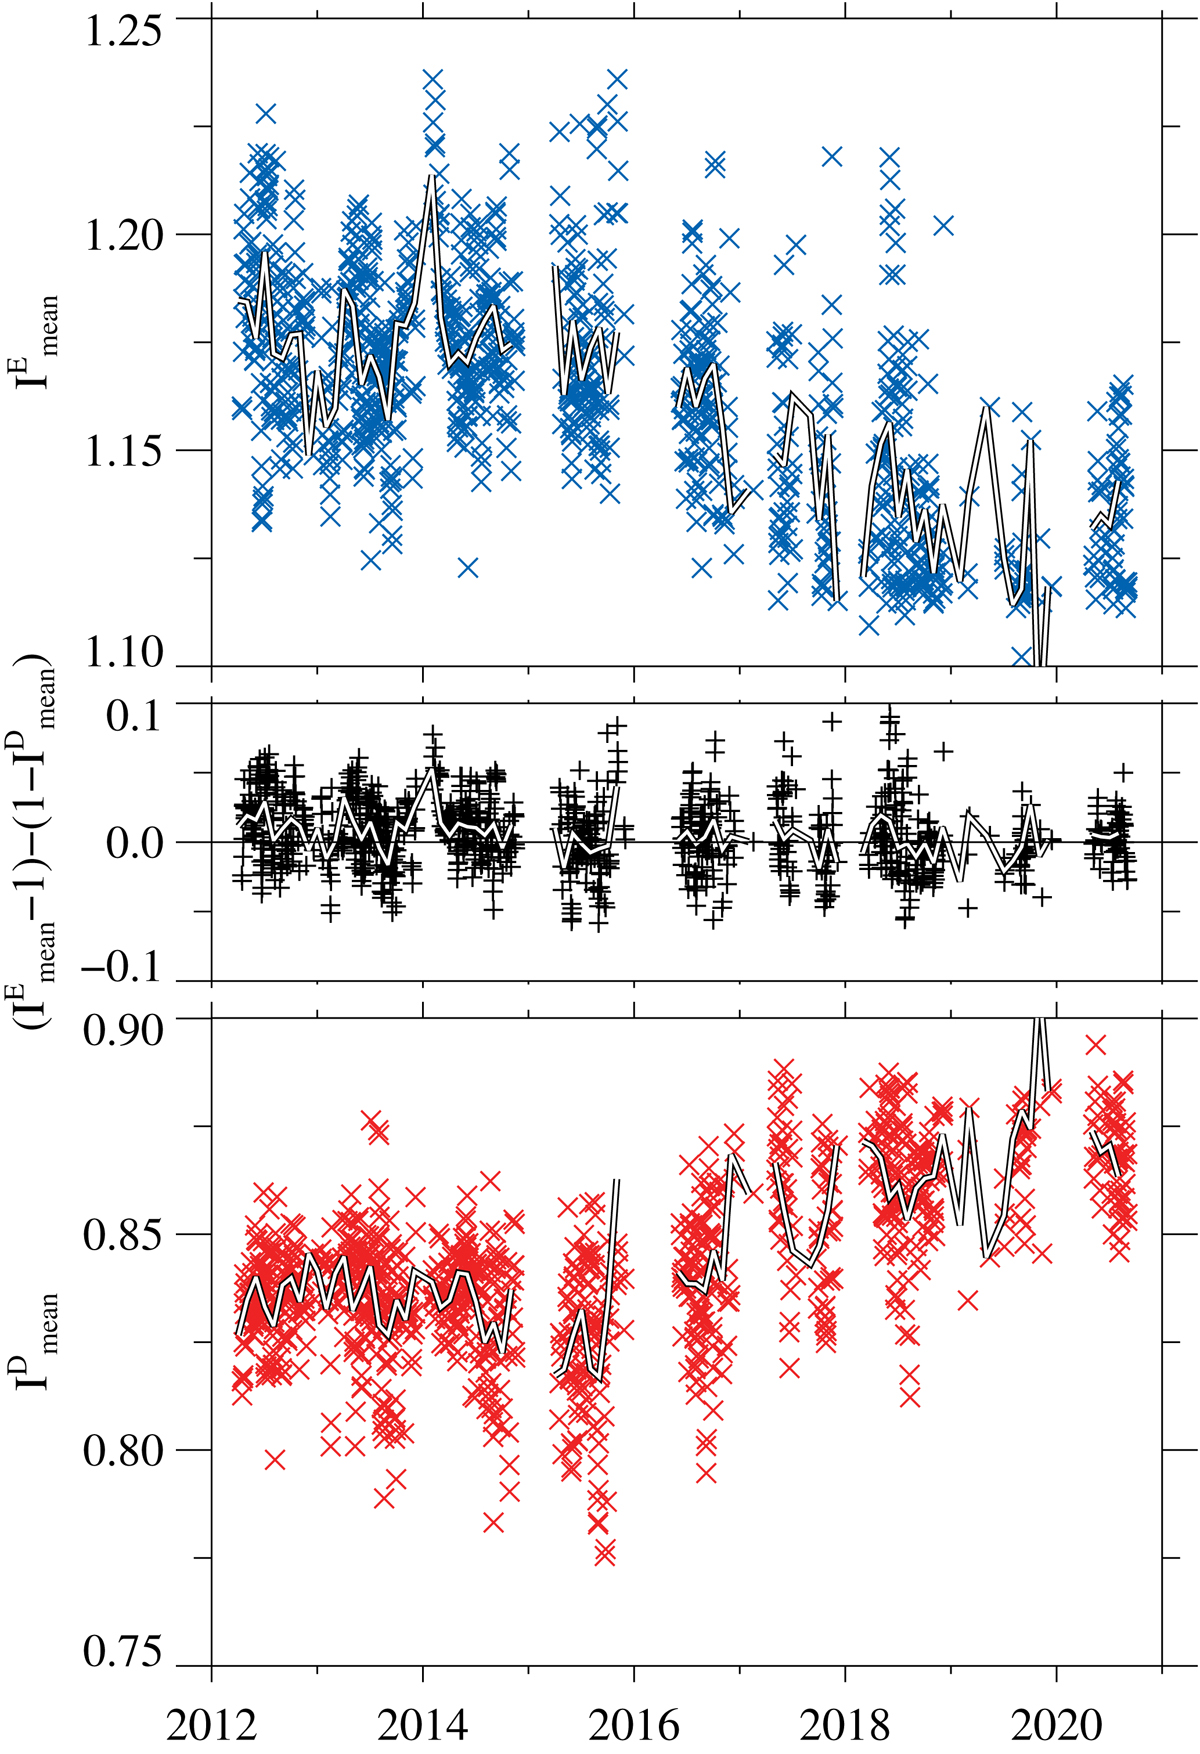
Comparison of the mean intensity of bright Hα regions ![]() (blue crosses, top panel) and the mean intensity of dark Hα absorbing regions
(blue crosses, top panel) and the mean intensity of dark Hα absorbing regions ![]() (red crosses, bottom panel) relative to the median intensity. In the middle panel, the relative distance to an intensity of Imean = 1 of
(red crosses, bottom panel) relative to the median intensity. In the middle panel, the relative distance to an intensity of Imean = 1 of ![]() and
and ![]() is displayed. In addition, the monthly mean is shown with a white line.
is displayed. In addition, the monthly mean is shown with a white line.
Current usage metrics show cumulative count of Article Views (full-text article views including HTML views, PDF and ePub downloads, according to the available data) and Abstracts Views on Vision4Press platform.
Data correspond to usage on the plateform after 2015. The current usage metrics is available 48-96 hours after online publication and is updated daily on week days.
Initial download of the metrics may take a while.