Fig. 2.
Download original image
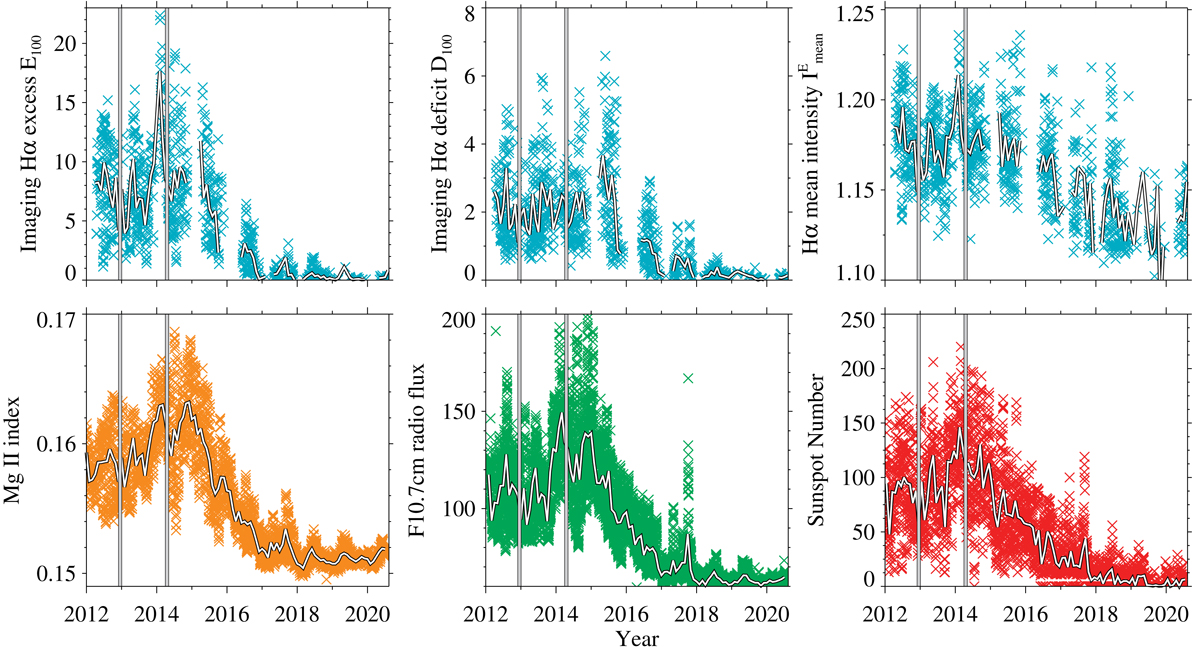
Comparison of the imaging Hα excess with different solar activity indices during Solar Cycle 24 in 2012–2020. Top row: imaging Hα excess E100 of bright features (left), imaging Hα deficit D100 of dark features (middle), and mean intensity of Hα excess regions ![]() (right). Bottom row: Mg II index (left), F10.7 cm radio flux (middle), and relative sunspot number (right) for daily observations. The monthly average for all tracers is shown as a white line. The gray areas in the background indicate the northern and southern magnetic field reversals in November 2012 and March 2014, respectively.
(right). Bottom row: Mg II index (left), F10.7 cm radio flux (middle), and relative sunspot number (right) for daily observations. The monthly average for all tracers is shown as a white line. The gray areas in the background indicate the northern and southern magnetic field reversals in November 2012 and March 2014, respectively.
Current usage metrics show cumulative count of Article Views (full-text article views including HTML views, PDF and ePub downloads, according to the available data) and Abstracts Views on Vision4Press platform.
Data correspond to usage on the plateform after 2015. The current usage metrics is available 48-96 hours after online publication and is updated daily on week days.
Initial download of the metrics may take a while.