Fig. 2.
Download original image
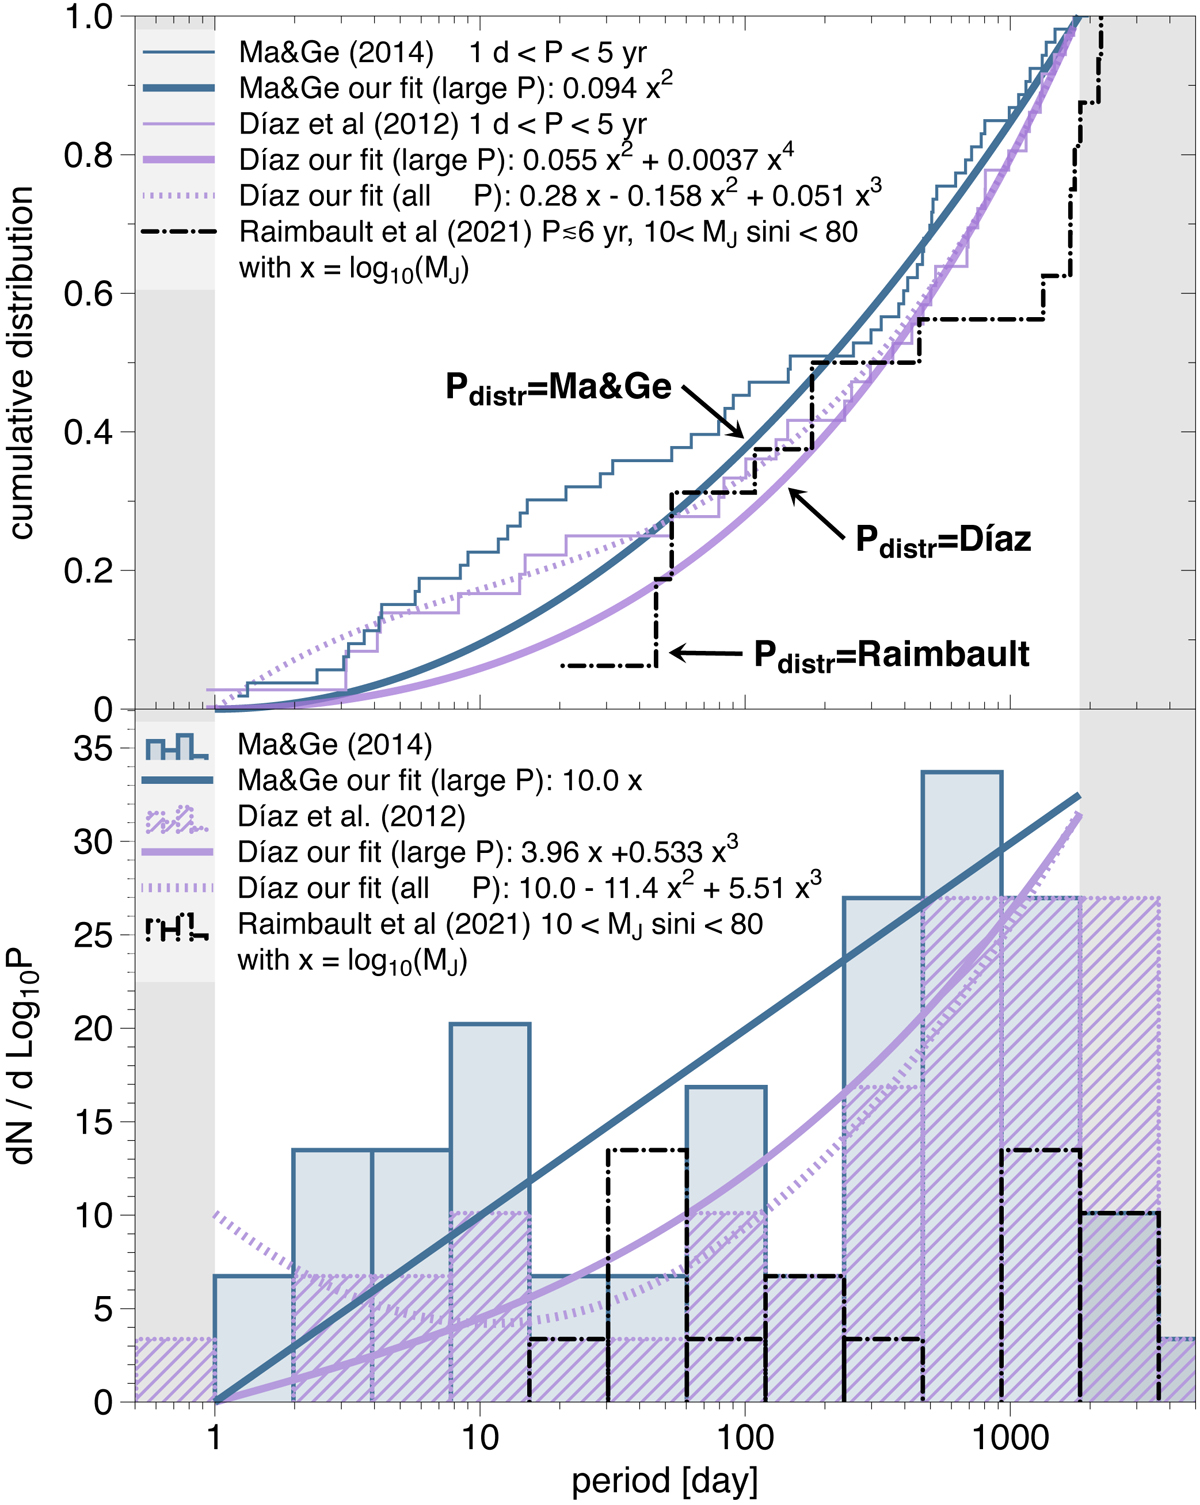
Period distribution of the BD sample from Ma & Ge (2014) and Díaz et al. (2012) which have masses of between 9 and 90 MJ orbiting solar-type stars. Top: cumulative distribution function for BDs. The ‘large P’ fits of Ma & Ge and Díaz are used to generate the BD period distributions and are referred to as Pdistr = Ma & Ge and Pdistr = Díaz, respectively. Bottom figure: log-binned histogram with the corresponding fit curves (bin size log10(1.98)). Our simulations are limited to the indicated (non-shaded) period range 1 d < P< 5 yr. The Raimbault (in prep.) data are used for an additional bootstrap sample estimate (Sect. 5.2).
Current usage metrics show cumulative count of Article Views (full-text article views including HTML views, PDF and ePub downloads, according to the available data) and Abstracts Views on Vision4Press platform.
Data correspond to usage on the plateform after 2015. The current usage metrics is available 48-96 hours after online publication and is updated daily on week days.
Initial download of the metrics may take a while.