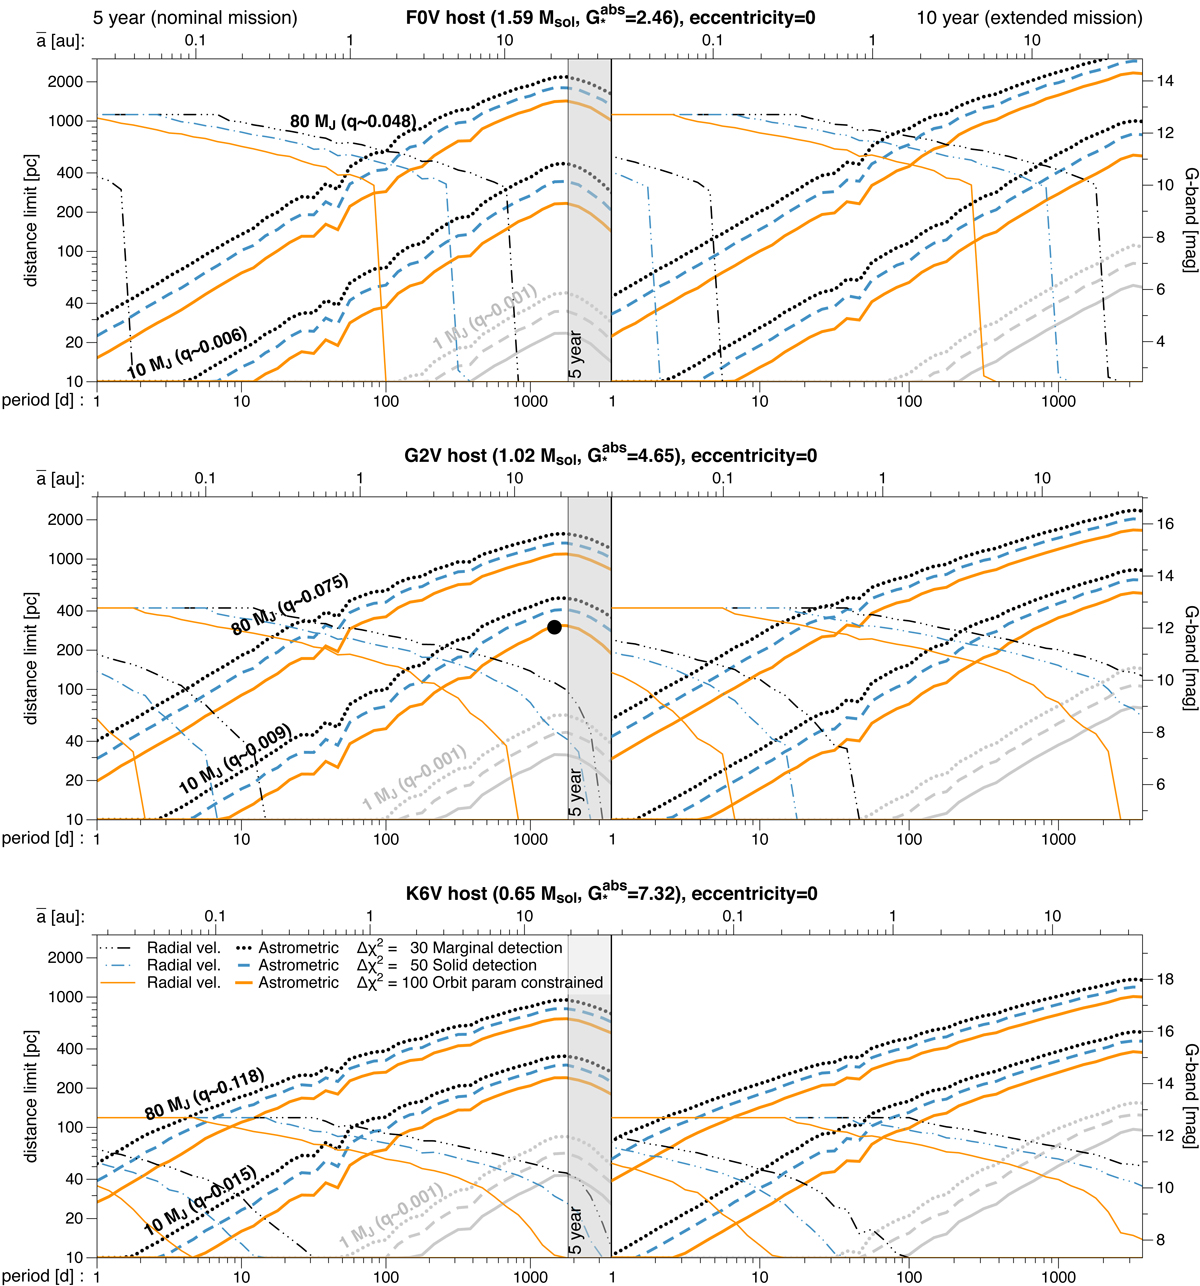
Fig. A.2.
Download original image
Illustration of the Gaia astrometric and radial velocity detection limits for the adopted BD mass range 10– 80 MJ around a F0V/G2V/K6V main sequence star (top/middle/bottom respectively) for different Δχ2 detection thresholds (see Sect. 2.1) resulting from a simulated five-year nominal mission (left) and ten-year extended mission (right). For each Δχ2 detection threshold, the lines show for a given period (bottom axis) and semi-major axis (top axis), the zero-extinction limits in distance (left axis) and apparent G-band magnitude (right-axis) for which 50% of the simulated sky positions are no longer detectable. The ascending thick lines are the astrometric limits, while the descending thin lines are the radial velocity limits. We note that the latter are truncated due to the GRVS = 12 limit (see text for details). For the dot in the middle panel, the astrometric eccentricity dependence and sky-position variation is expanded in Fig. A.1; see Sect. A for more details. For comparison, in grey we include the astrometric detection thresholds for a 1 MJ planet (it is not detectable using Gaia radial velocity).
Current usage metrics show cumulative count of Article Views (full-text article views including HTML views, PDF and ePub downloads, according to the available data) and Abstracts Views on Vision4Press platform.
Data correspond to usage on the plateform after 2015. The current usage metrics is available 48-96 hours after online publication and is updated daily on week days.
Initial download of the metrics may take a while.