Free Access
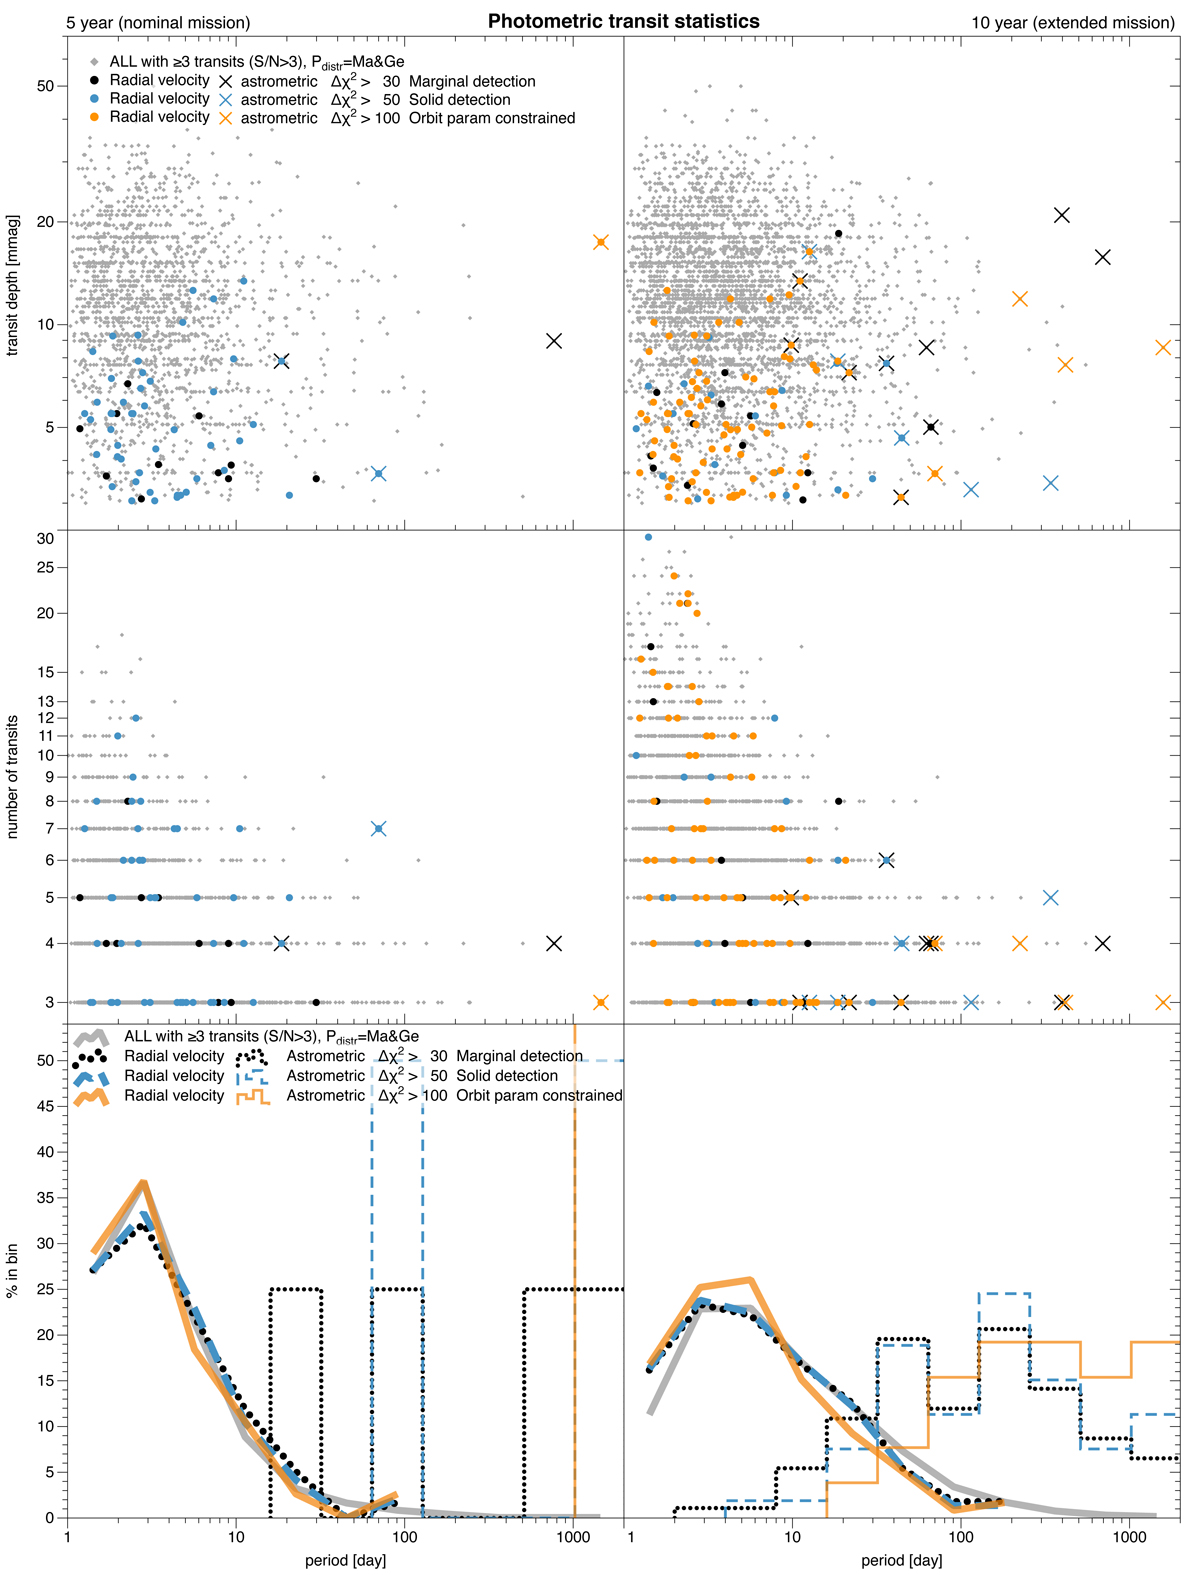
Fig. 11.
Download original image
Transit statistics from the Pdistr = Ma & Ge simulation for a five-year and ten-year mission of 1.5 million randomly oriented BDs. These BD number counts are scaled by 0.6 to represent a 0.6% BD occurrence rate in Table 1; see Sect. 3.3. Detailed period-binned statistics of the ‘ALL’ part are shown in Table 2.
Current usage metrics show cumulative count of Article Views (full-text article views including HTML views, PDF and ePub downloads, according to the available data) and Abstracts Views on Vision4Press platform.
Data correspond to usage on the plateform after 2015. The current usage metrics is available 48-96 hours after online publication and is updated daily on week days.
Initial download of the metrics may take a while.