Fig. 4.
Download original image
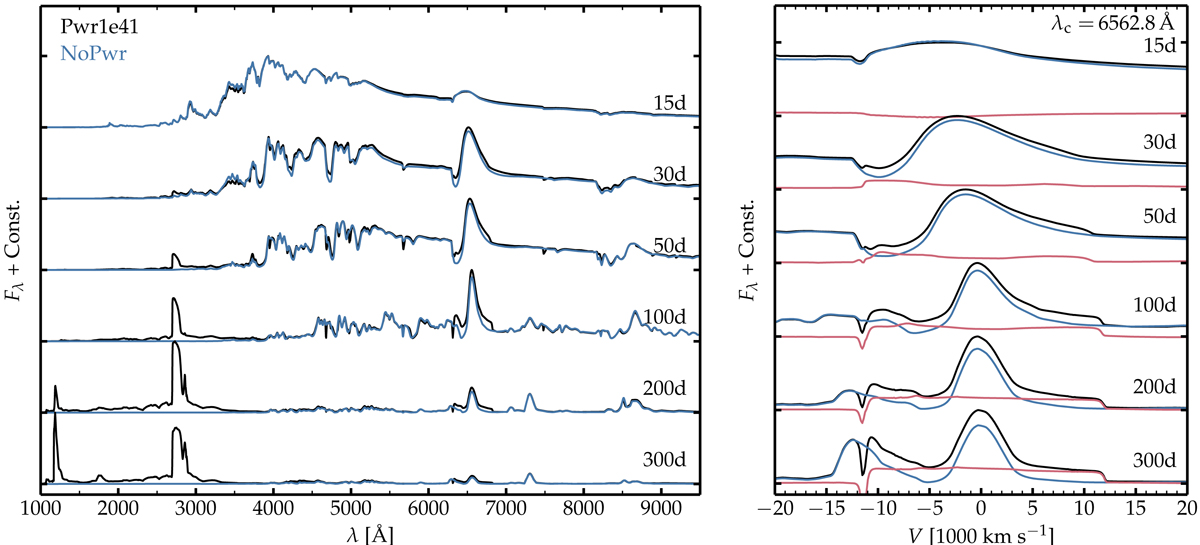
Impact of shock power on spectral properties. Left: time evolution of the spectral properties in the UV and in the optical for the SN II model with an interaction power of 1041 erg s−1 (black) and the model without interaction power (blue). Both models have, however, the same ejecta density structure (short-dashed curve in Fig. 1). For each epoch, the spectra were divided by the maximum flux of the brighter model and then stacked for visibility. Right: same as on the left, but now showing the spectra versus Doppler velocity and centered on the rest wavelength of Hα. The red curve shows the flux difference between the two models.
Current usage metrics show cumulative count of Article Views (full-text article views including HTML views, PDF and ePub downloads, according to the available data) and Abstracts Views on Vision4Press platform.
Data correspond to usage on the plateform after 2015. The current usage metrics is available 48-96 hours after online publication and is updated daily on week days.
Initial download of the metrics may take a while.