Fig. 3.
Download original image
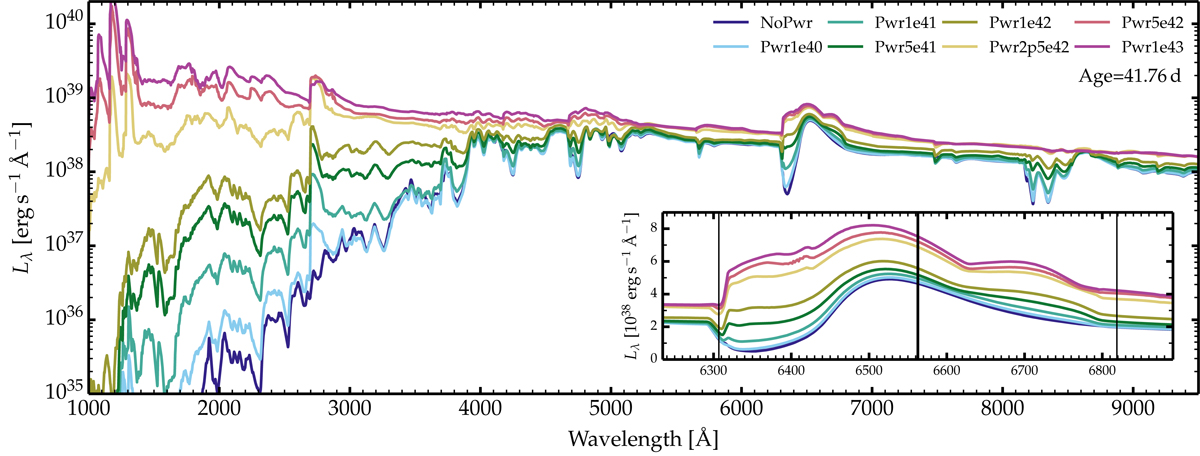
Spectral properties for our set of models. Comparison of the observer’s frame luminosity in the UV and optical ranges for our set of models with an interaction power covering from zero to 1043 erg s−1 and at a time of 41.76 d. The inset zooms on the Hα region. The thick vertical line represents the rest wavelength of Hα, and the thin vertical lines indicate the wavelength at ±11 700 km s−1 away from that rest wavelength.
Current usage metrics show cumulative count of Article Views (full-text article views including HTML views, PDF and ePub downloads, according to the available data) and Abstracts Views on Vision4Press platform.
Data correspond to usage on the plateform after 2015. The current usage metrics is available 48-96 hours after online publication and is updated daily on week days.
Initial download of the metrics may take a while.