Fig. 1.
Download original image
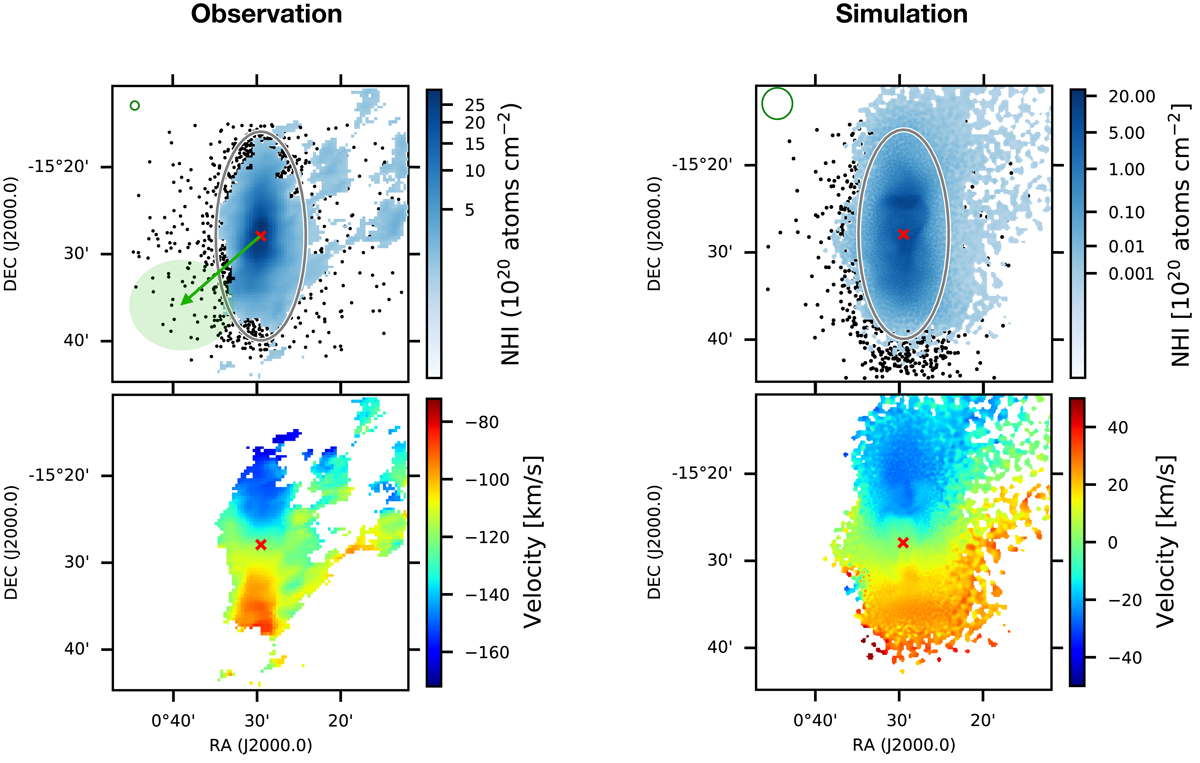
Evidence of ram-pressure in WLM. Top-left: MeerKAT H I column density map (blue) superimposed on WLM member stars (black dots) identified from the Subaru observations. The red cross indicates the optical center of WLM, and the 12′ ellipse encloses the main body of the WLM H I (the same ellipse applies to the simulation). The green arrow shows the direction of WLM’s proper motion, and its one-sigma error is indicated by a transparent green circle. The small green circle at the top-left corner indicates the beam size of the H I data. Bottom-left: MeerKAT H I velocity map. Right: same mappings but for a simulation that uses a space velocity of 500 km s−1 for WLM and an IGM density of nIGM = 4 × 10⁻⁶ atoms cm−3. The green circle in the top-right panel indicates the typical spatial resolution of gas particles in the simulation, i.e., twice the smoothing length of gas particles, specifically for the region near and outside the ellipse of the main body.
Current usage metrics show cumulative count of Article Views (full-text article views including HTML views, PDF and ePub downloads, according to the available data) and Abstracts Views on Vision4Press platform.
Data correspond to usage on the plateform after 2015. The current usage metrics is available 48-96 hours after online publication and is updated daily on week days.
Initial download of the metrics may take a while.