Free Access
Fig. 3.
Download original image
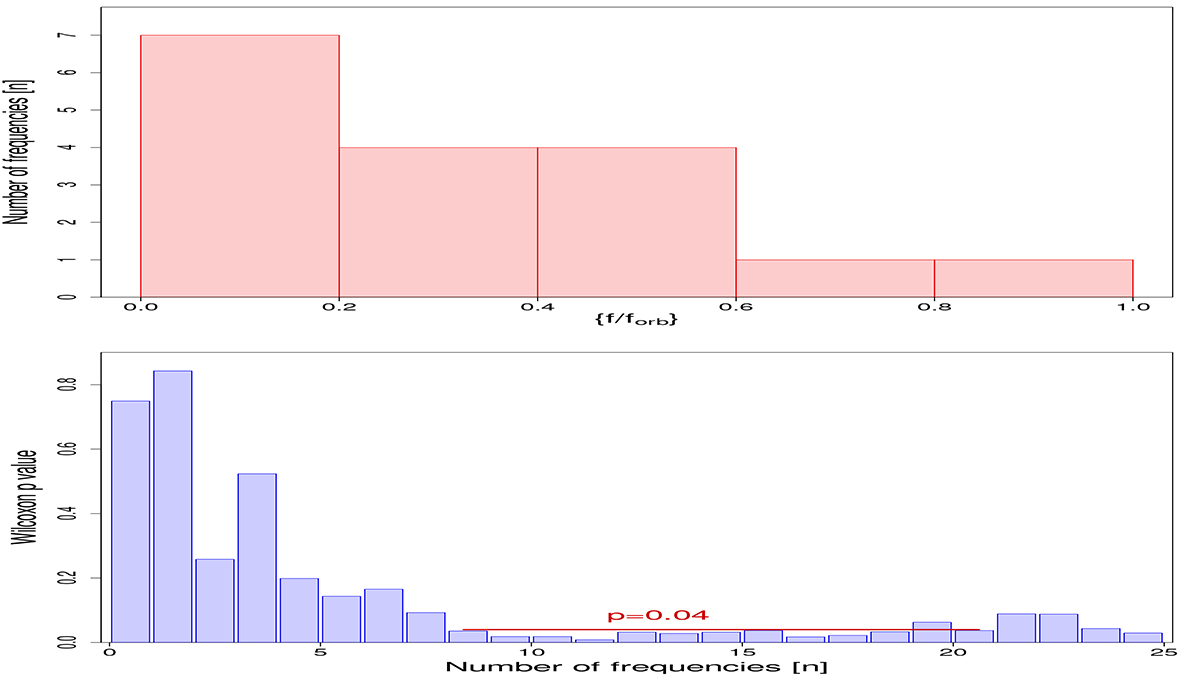
Distribution of the fractional frequencies of the 17 highest amplitude components (upper panel) and the Wilcoxon p values of the fractional part of the n highest amplitude frequencies compared to a uniform distribution (lower panel).
Current usage metrics show cumulative count of Article Views (full-text article views including HTML views, PDF and ePub downloads, according to the available data) and Abstracts Views on Vision4Press platform.
Data correspond to usage on the plateform after 2015. The current usage metrics is available 48-96 hours after online publication and is updated daily on week days.
Initial download of the metrics may take a while.