Fig. 2.
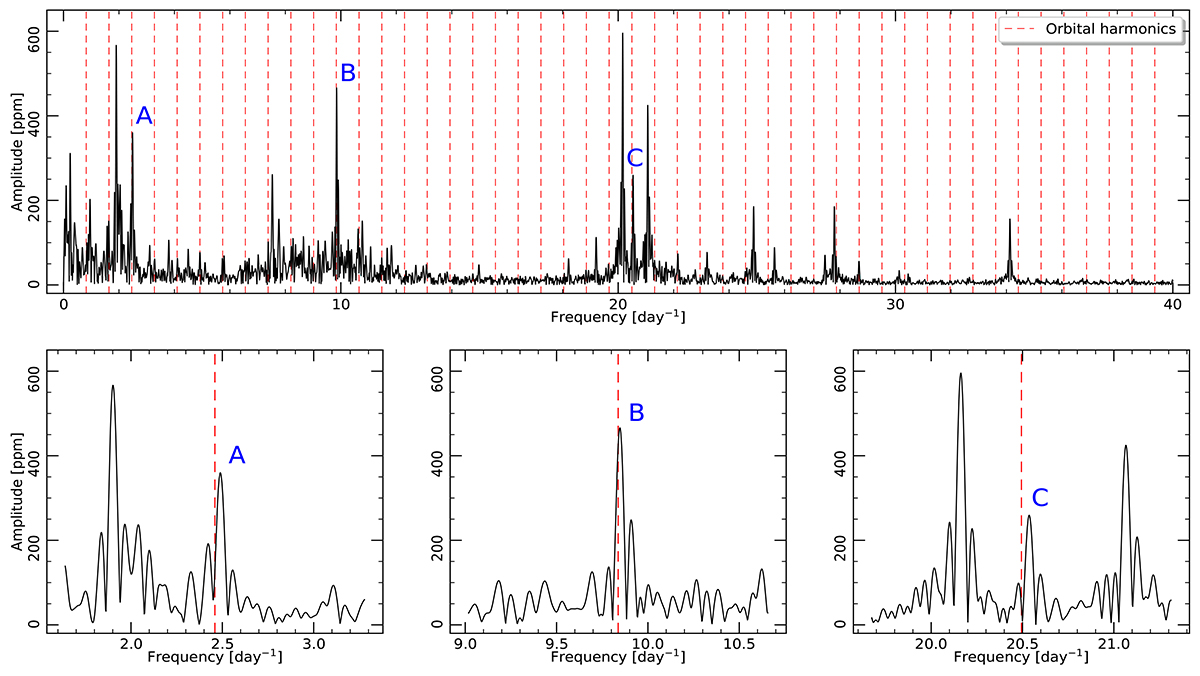
Download original image
Computed Fourier spectrum (top panel, black), the orbital frequency, and the first 47 orbital harmonics (top panel, dashed red lines) that cover the range of frequencies < 40 days−1, above which no significant peaks are found. The bottom row shows the 3rd, 12th, and 25th orbital harmonics (dashed red lines) and the zoomed-in parts of the spectrum that correspond to these frequencies.
Current usage metrics show cumulative count of Article Views (full-text article views including HTML views, PDF and ePub downloads, according to the available data) and Abstracts Views on Vision4Press platform.
Data correspond to usage on the plateform after 2015. The current usage metrics is available 48-96 hours after online publication and is updated daily on week days.
Initial download of the metrics may take a while.